Figure 3.
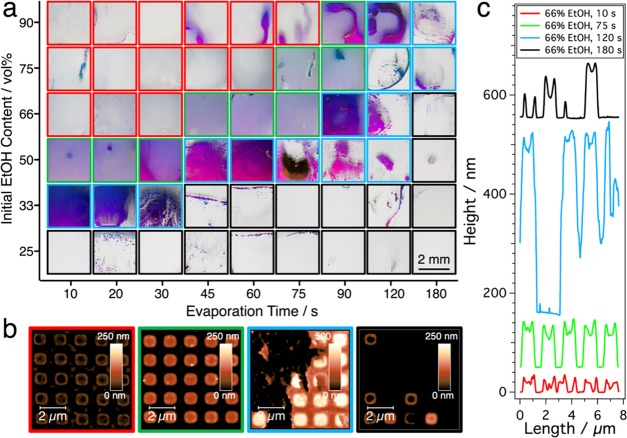
Influence of initial EtOH content and evaporation time prior to contact with the substrate (particle concentration constant @ 100 mM Au0). Four different substrate qualities can be distinguished, marked with colored frames in (a). EtOH concentrations below 33 vol % always yielded empty substrate centers. Dispersions with higher alcohol content produced very homogeneous arrays (green), with correct timing. To avoid underfilling (red), longer waiting times were required for higher initial EtOH concentrations, whereby excessive solvent evaporation leads to particle accumulation at the substrate center (blue) in all series. AFM height images in (b) for substrates from the series with an initial EtOH content of 66 vol % correspond to evaporation times of 10, 75, 120, and 180 s (from left to right). The cross sections in (c) were measured for the bottom row of the corresponding square arrays in the AFM images and plotted with an offset in the z-direction for the sake of clarity.

