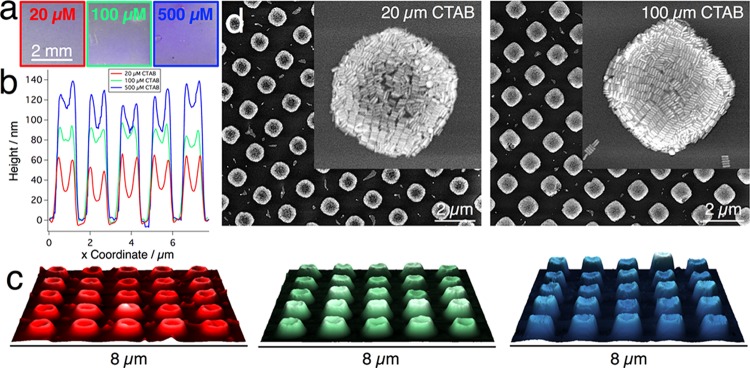
Figure 6.
Influence of CTAB surfactant concentration (20–500 μm). (a) Photographs of three substrates obtained at different [CTAB], revealing similar macroscopic homogeneity. (b) Cross sections measured from AFM height images (c), which show increasing average post height with surfactant concentration in the dispersion, and the presence of an elevated rim in all posts. (d) SEM micrographs for low and intermediate CTAB concentrations demonstrate that complete filling is only reached above a minimum surfactant concentration.

