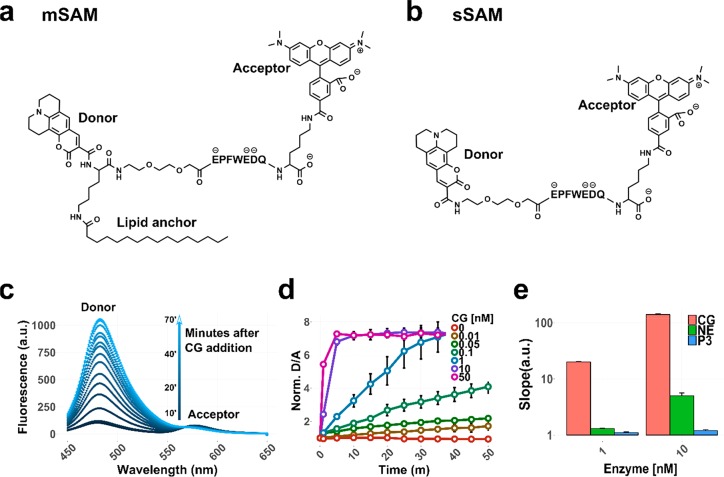
Figure 1.
Chemical structures of mSAM and sSAM and their biochemical characterization. (a, b) Chemical structures. (c) Time-dependent change in fluorescence spectra of mSAM after addition of 1 nM cathepsin G (CG) measured in a phosphatidylcholine/phosphatidylserine (PC/PS) (9:1) liposome system. (d) Cleavage rates of mSAM as normalized donor/acceptor emission intensities at six different CG concentrations over time. Data are shown as mean ± SEM. (e) Linear regression slopes of mSAM cleavage rates for cathepsin G (CG), neutrophil elastase (NE), and proteinase 3 (PR3) at different enzyme concentrations. Data are shown as log10 of the linear regression slopes. Experiments were performed in technical triplicates.

