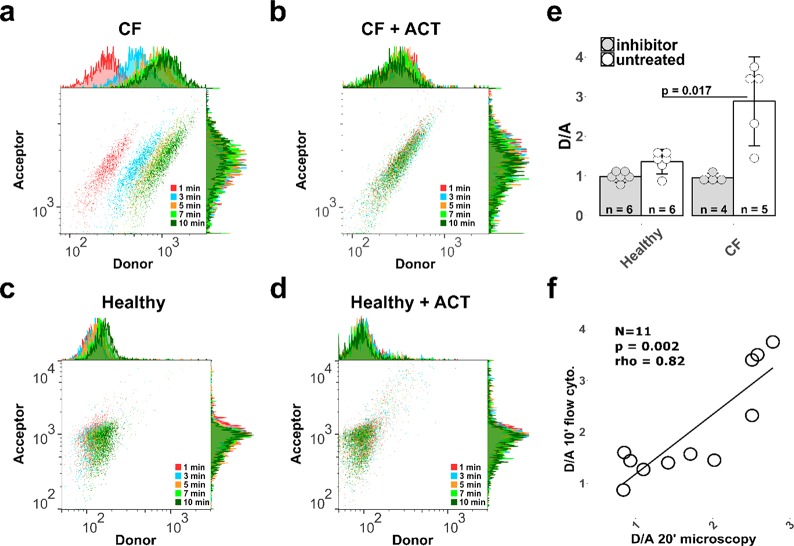
Figure 3.
Introducing small-molecule FRET flow cytometry. (a–d) Representative flow cytometry neutrophil-specific ratiometric measurement of surface-bound CG activity at different time points after mSAM addition. (e) Average D/A ratio measured on sputum neutrophils derived from 11 human subjects (6 healthy donors and 5 CF) after 10 min and (f) their correlation with the respective microscopy measurement (n = 50–70 for microscopy, n ≥ 1000 for flow cytometry). Data are represented as mean ± SD. Each human sample was measured in duplicate. Statistics were calculated by Wilcoxon rank sum and Spearman rank correlation tests.

