Figure 2.
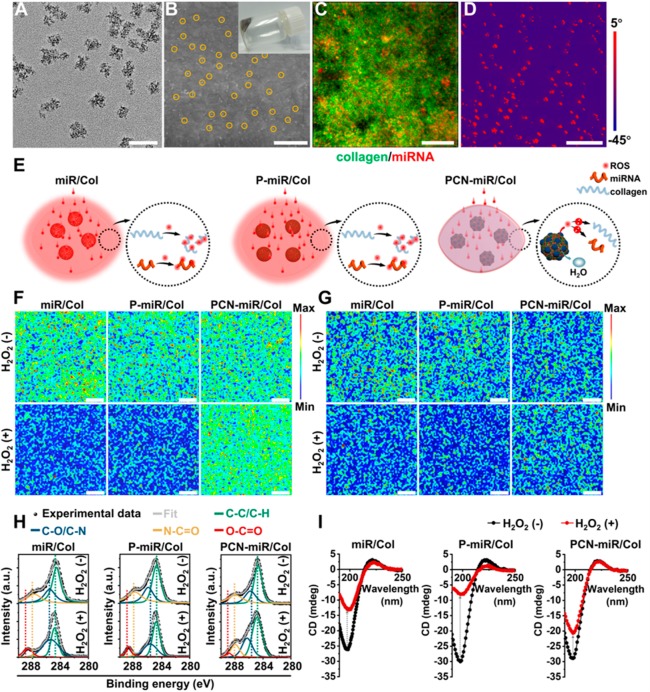
Characterization of PCN-miR/Col hydrogel and their resistance to oxidative denaturation. (A) TEM image of PCN-miR. Scale bar, 50 nm. (B) SEM image of the surface of PCN-miR/Col (inset: digital photograph of PCN-miR/Col hydrogel). The PCN-miR (marked by yellow solid circles) was clearly observed. Scale bar, 1 μm. (C) Three-dimensional confocal laser scanning microscopy (CLSM) image of PCN-miR/Col, where collagen from the hydrogel is labeled with fluorescein isothiocyanate (green), and antagomiR-26a is tagged with Cy5 (red). Scale bar, 100 μm. (D) AFM phase image of PCN-miR/Col. Scale bar, 500 nm. (E) Schematic illustration of the responses of collagen-based hydrogels under ROS exposure. Confocal Raman mapping of collagen-based hydrogels before (upper panel) and after (lower panel) exposure to H2O2: (F) the 1280 cm–1 peak corresponds to the amide III from collagen, and (G) the 810 cm–1 peak corresponds to the backbone O-P-O stretching from antagomiR-26a. Scale bars, 20 μm. (H) Deconvoluted high-resolution C1s XPS and (I) CD spectra of collagen-based hydrogels with or without exposure to H2O2. The XPS spectra were fitted to four energy components centered at around 284.6 (C-C/C-H), 285.5 (C-O/C-N), 287.8 (N-C=O), and 288.6 (O-C=O) eV.

