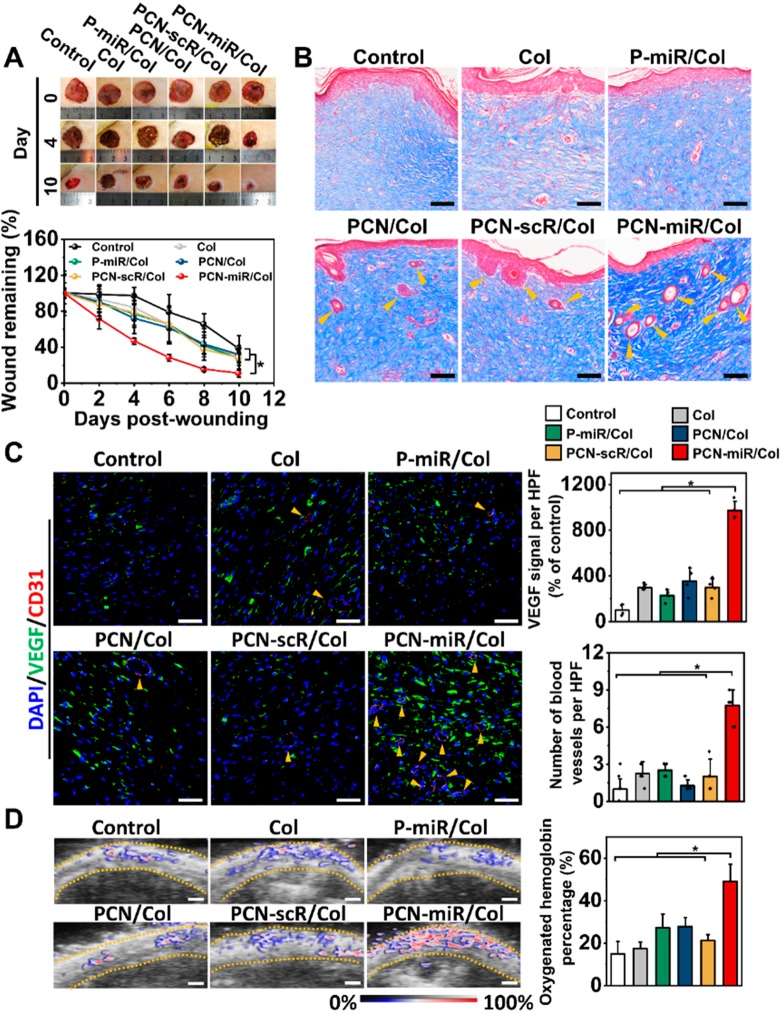
Figure 5.
PCN-miR/Col induces accelerated and regenerative diabetic wound healing in vivo. (A) Digital images of wounds at day 0, 4, and 10 after the indicated treatment (left panel) and quantification of wound closure as a percentage of the initial wound area (right panel, n = 5). (B) Masson’s trichrome staining of representative wound tissues from each group after 28 days of treatment. Scale bars, 100 μm. (C) Representative confocal images of VEGF and CD31 double-stained sections and quantification for VEGF expression and number of blood vessels per high-powered field (HPF) from each group at day 28. Scale bars, 50 μm. n = 4. (D) Photoacoustic images and quantification for oxygenated hemoglobin from each group at day 28. Scale bars, 1 mm. n = 3. All results are presented as mean ± SD, *P < 0.05 by two-tailed unpaired Student’s t tests.

