
Figure 1.
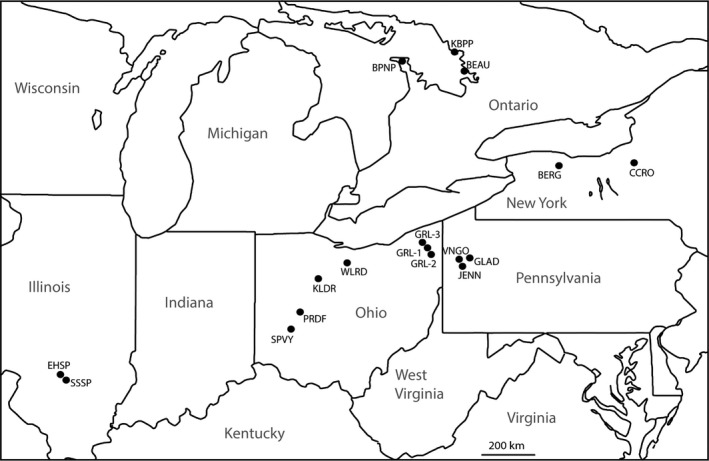
Map showing locations of populations of Sistrurus catenatus analyzed in this study. Summaries of genetic variation for RADSeq and microsatellite loci are given in Table 1
Official websites use .gov
A
.gov website belongs to an official
government organization in the United States.
Secure .gov websites use HTTPS
A lock (
) or https:// means you've safely
connected to the .gov website. Share sensitive
information only on official, secure websites.
Map showing locations of populations of Sistrurus catenatus analyzed in this study. Summaries of genetic variation for RADSeq and microsatellite loci are given in Table 1