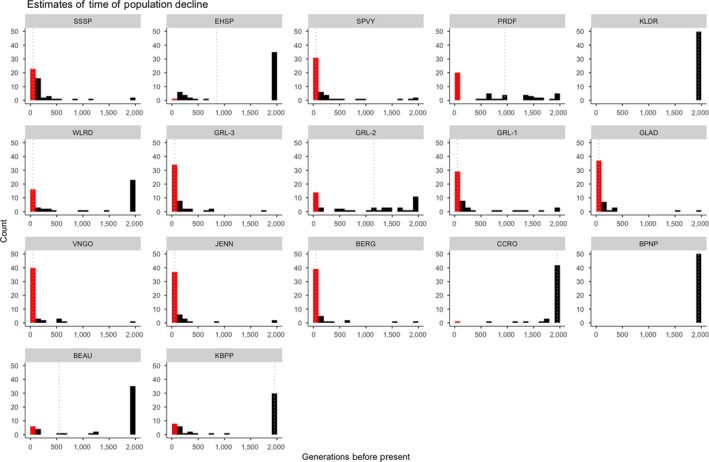
Figure 4.

Histograms representing maximum‐likelihood estimates from fastsimcoal of the number of generations in the past at which a decline in population size occurred for each of the 17 populations. The dotted gray line indicates the bin containing the point estimate (see Table S4), and distributions reflect estimates from 50 bootstrapped datasets for each population. Times along the x‐axis are binned into intervals of 100 generations. The bin of 0–100 generations, roughly corresponding to an anthropogenic timeframe (~200 years), is indicated with red. All estimates exceeding 2,000 generations are combined into the 2,000 generation bin
