
Figure 5.
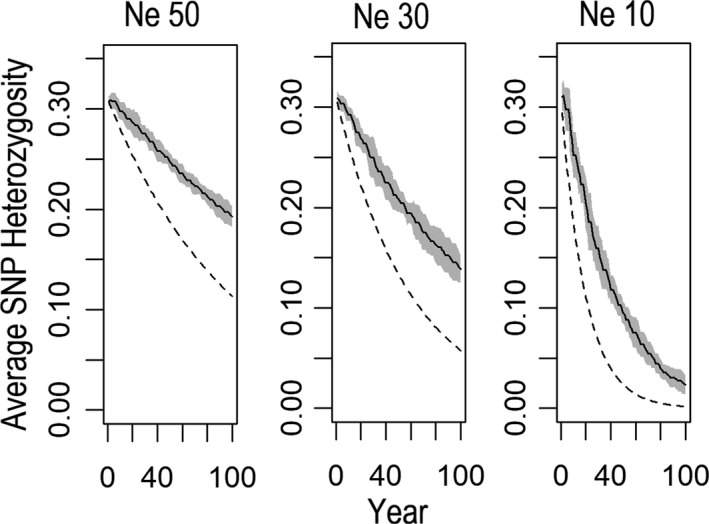
Results of simulations showing the projected loss of existing levels of variation (estimated as He) over time for populations of varying effective size. Trajectories are shown for fixed Ne values of 50, 30, and 10 individuals from results based on the SimuPOP simulations (point estimates shown by solid line +95% CI polygons) or the analytical formula for loss of He over time in a bottlenecked population