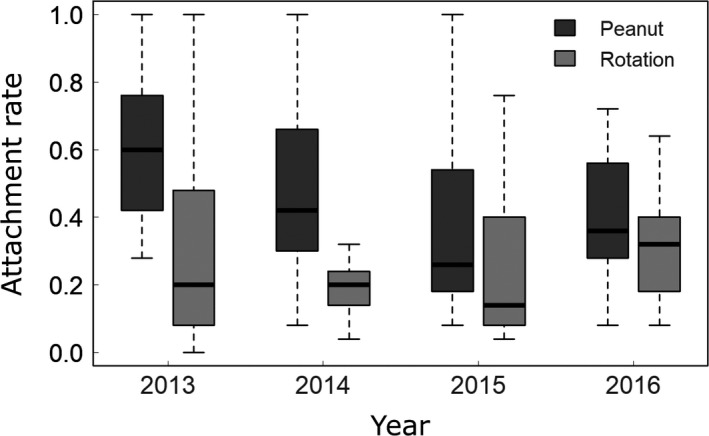
Figure 2.

Endospore attachment rates by treatment. Endospore attachment rates were higher with soils collected from peanut plots vs. rotation plots. Attachment rate was calculated as the fraction of 25 tested hosts with endospores attached. Each boxplot represents 16 estimates of attachment rate (four clonal lines by four plots/treatment)
