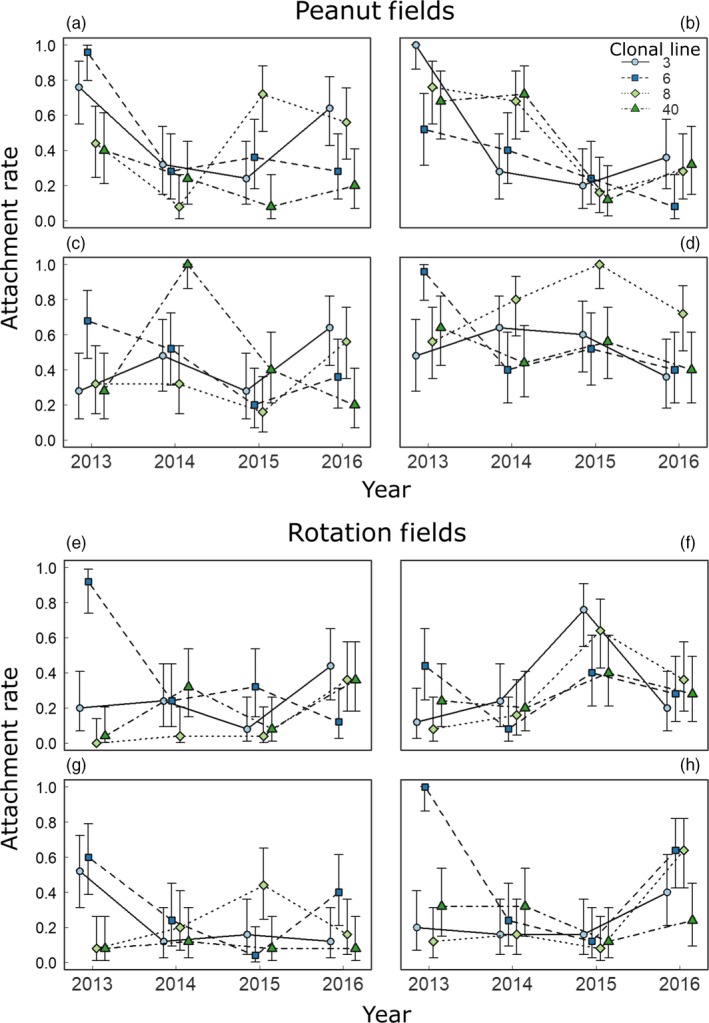
Figure 4.

Temporal change in Pasteuria penetrans specificity at the local level. The fraction of hosts with attached endospores is shown for each of the four peanut (a–d) and rotation (e–h) plots. The relative attachment rates to host lines, and even their rank order, varied between years in the same plot and between plots in the same year, consistent with spatial and temporal variation in host specificity. Each data point is estimated from 25 hosts. Error bars are 95% confidence intervals for the proportion calculated using the function binom.test in R
