
Figure 4.
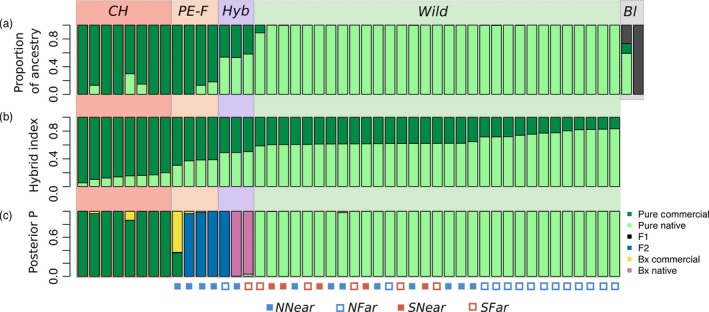
(a) Admixture proportions of each individual from K = 3, obtained in Structure for data set FEMALES; (b) genome‐wide admixture (hybrid index) for each individual, obtained in Introgress for data set NO_OUTGROUP; (c) posterior probability that each individual belongs to distinct genotype categories, either parentals (Pure Commercial or Pure Native) or hybrids (F1, F2, backcross with commercial or backcross with native), obtained in NewHybrids for data set MOST_DIFFERENTIATED. CH—commercial hives; PE‐F—possible escaped females; Hyb—potential hybrids; Wild—all other females collected in the wild; Bl—Bombus lucorum. Individuals are sorted according to hybrid index. Symbols in the bottom represent the groups where individuals come from, either NNear, NFar, SNear or SFar