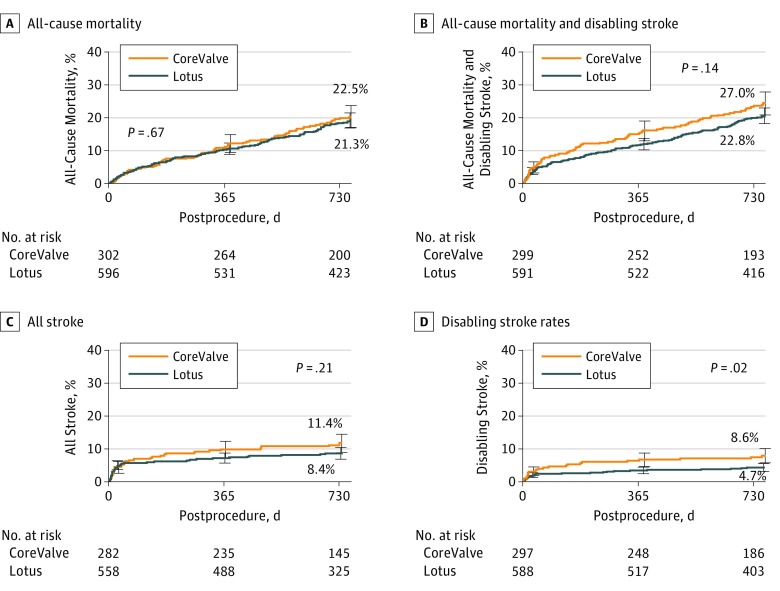
Figure 2. Cumulative Event Curve for Death and Stroke.
Two-year all-cause death (A), all-cause death and disabling stroke (B), all stroke (C), and disabling stroke rates in the intention-to-treat patient population (D). Event rates were calculated with Kaplan-Meier methods. Error bars indicate the standard error.

