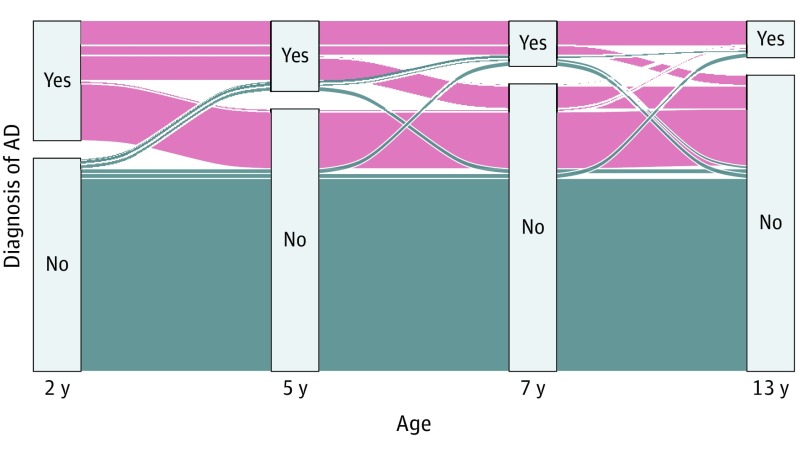
Figure 3. Changes in Atopic Dermatitis (AD) Diagnosis Over Time in 411 Children With AD in the Copenhagen Prospective Study on Asthma in Childhood 2000 Cohort.
The alluvial diagram visualizes each child’s individual AD course according to diagnosis at different cross-sectional time points. The blue areas represent the children who did not develop AD.

