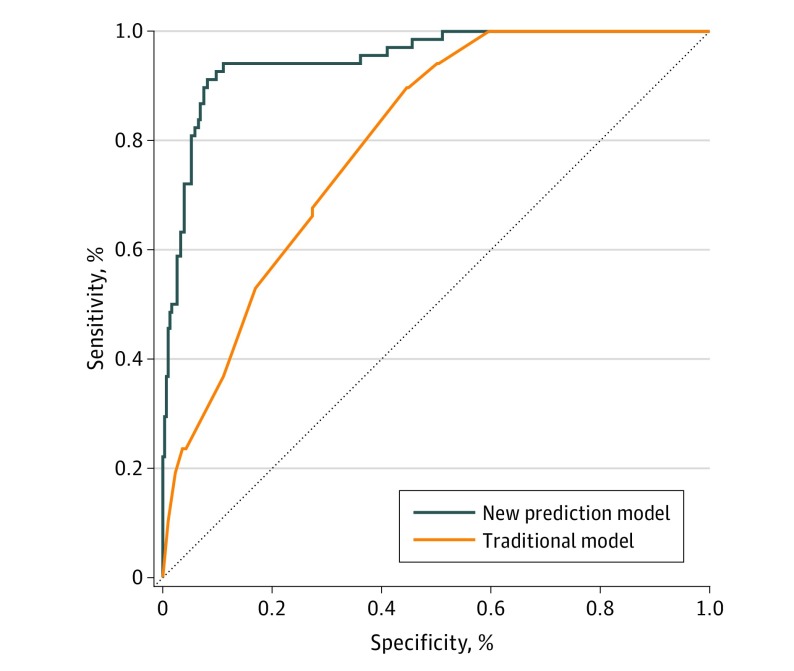
Figure 3. Comparison Between the Traditional Model and the New Collagen Signature–Based Prediction Model.
The orange line represents the new model (area under the receiver operating characteristic curve [AUROC], 0.950; 95% CI, 0.923-0.977), including the depth of tumor invasion, tumor differentiation, and the collagen signature. The blue line represents the traditional model (AUROC, 0.798; 95% CI, 0.749-0.847), including the depth of tumor invasion, tumor differentiation, and lymphovascular infiltration.

