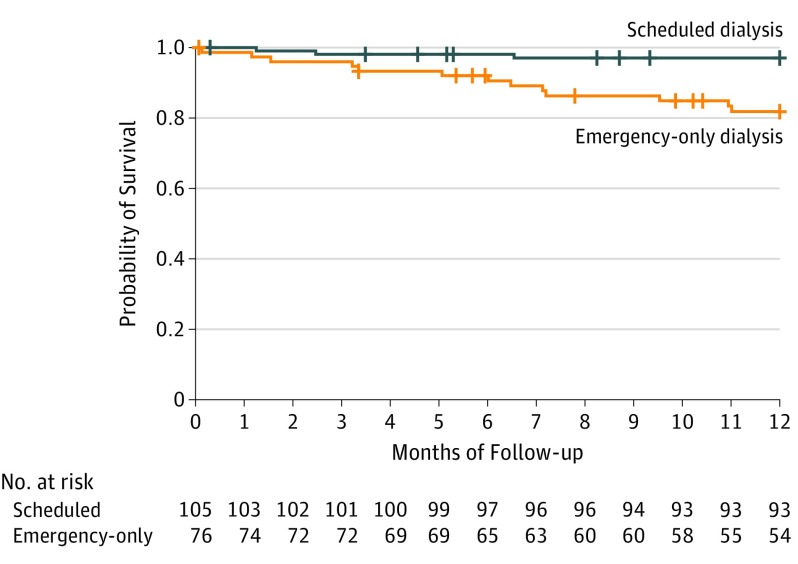
Figure 2. Survival Rates in Scheduled vs Emergency-Only Dialysis.
Figure shows the Kaplan-Meier estimates of overall survival during the 12-month follow-up period. Individuals were censored at death (n = 16) or loss to follow-up (n = 20). The overall unadjusted mortality rate was 3% in the scheduled dialysis group (n = 3) compared with 17% in the emergency-only dialysis group (n = 13; P = .001), corresponding to an estimated absolute risk reduction of 14% and number needed to treat of 7 at 12 months. The adjusted hazard ratio for death for emergency-only vs scheduled dialysis was 4.6 (95% CI, 1.2-18.2; P = .03) by log-rank test.

