
Figure 3. Exploratory Cancer Outcomes.
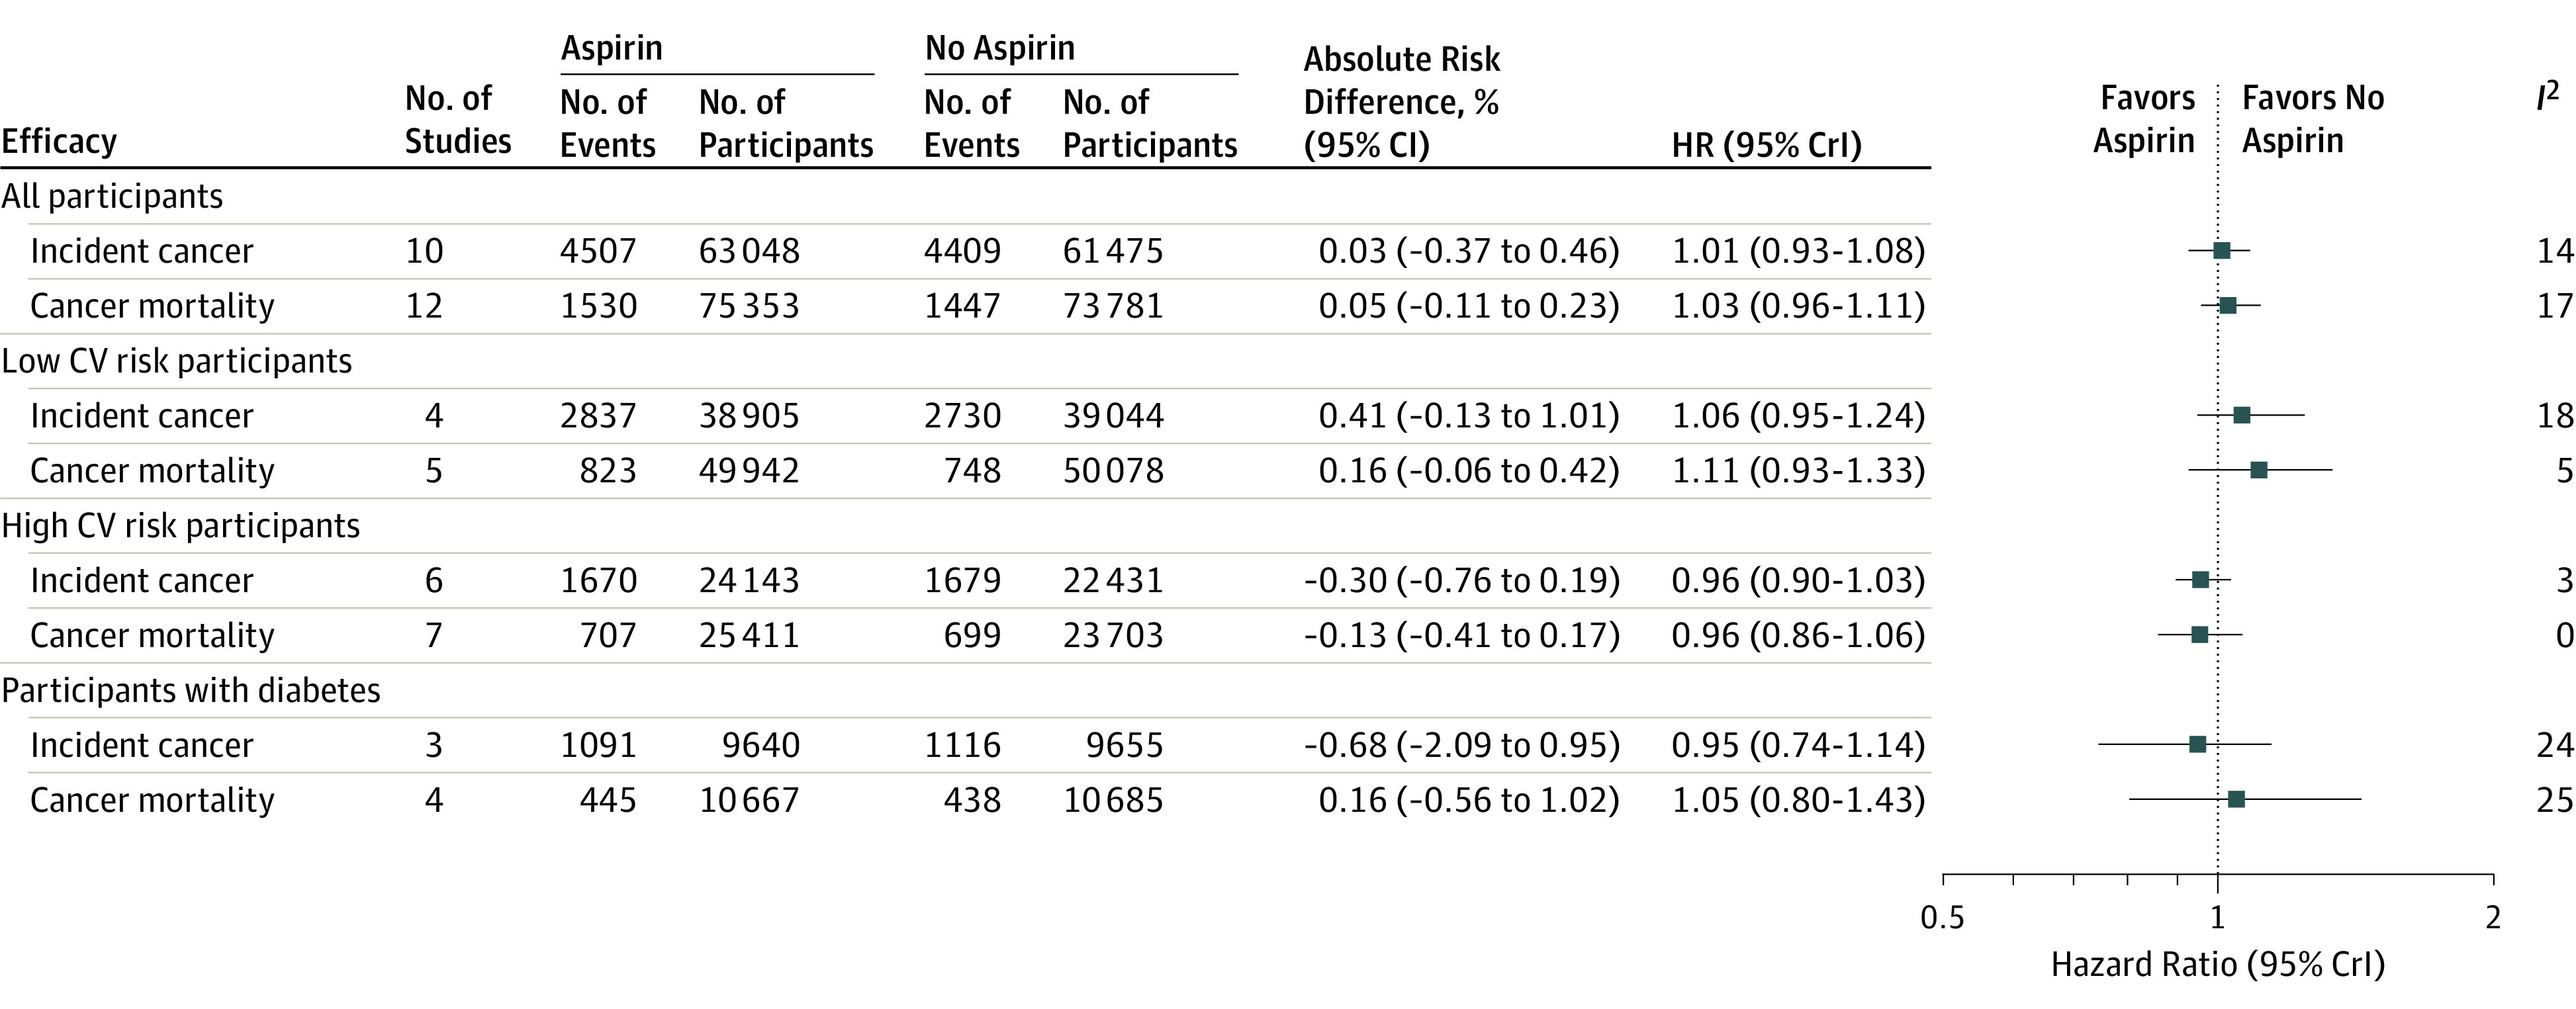
Cancer outcomes across all studies, in low and high cardiovascular risk populations, and in patients with diabetes. The absolute risk reductions and increases were calculated by multiplying the control event risk by the relative risk, and 95% CIs derived by frequentist meta-analysis (eFigure 4 in Supplement 2). Study heterogeneity was assessed using I2 statistics. HR indicates hazard ratio; CrI indicates credible interval; CV indicates cardiovascular. Data for the JPAD, JPPP, and WHS trials were extracted from subsequent trial publications on cancer outcomes.29,30,31 Data for the HOT, BDS, and PHS (cancer mortality) and the HOT, BDS, AAA, and POPADAD (incident cancer) trials were extracted from previous meta-analyses on cancer outcomes.14