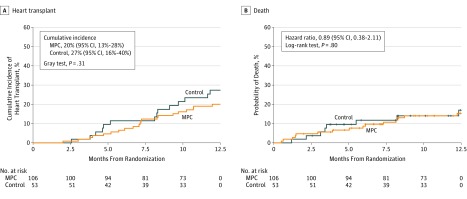
Figure 2. Cumulative Incidence for Transplant and Hazard for Death.
A, Nonparametric estimates of the cumulative incidence functions for heart transplant with death as a competing risk. The P value was computed using the Gray test. The median observation time was 7.1 months (interquartile range [IQR], 5.2-9.3 months) for the mesenchymal precursor cells (MPC) treatment group and 8.2 months (IQR, 4.6-9.7 months) for the control group.
B. Kaplan-Meier estimates of the cumulative hazard for death. The hazard ratio was based on the Cox proportional hazards model and the P value was computed from log-rank test. Median observation time was 5.0 months (IQR, 1.4-8.2 months) for the MPC group and 3.5 months (IQR, 2.6-6.9 months) for the control group.

