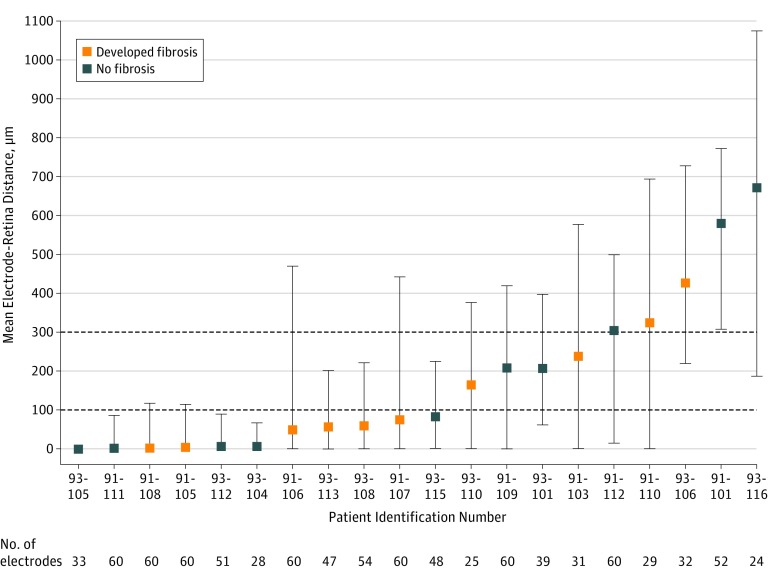
Figure 2. Mean Electrode-to-Retina Distance for All 20 Patients.
Mean electrode-to-retina distance for each patient was placed in ascending order, and error bars represent data distribution. Of 1200 electrodes (60 electrodes of 20 implants), the distance could be measured for 913 electrodes (76.1%). For the remaining 287 electrodes (23.9%), optical coherence tomography scans did not cover all of the implanted area and this measure could not be assessed.

