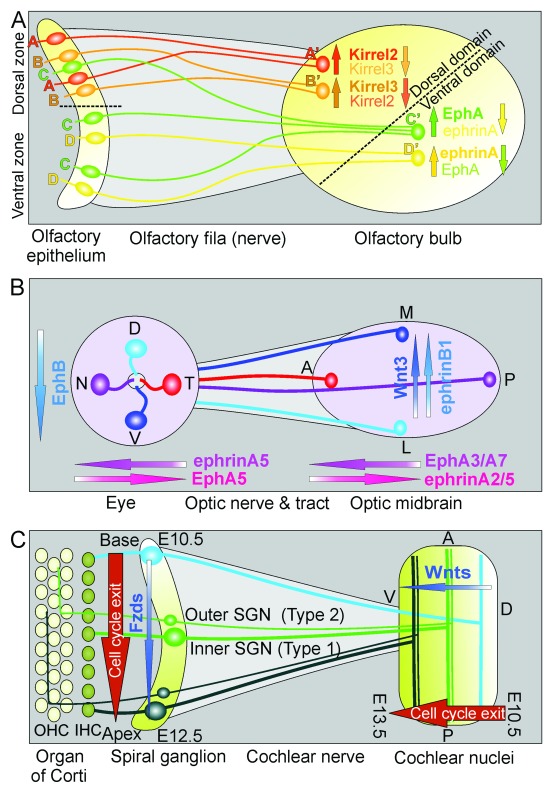
Figure 1. Development of three distinct mammalian sensory maps.
Molecular cues ( A, B) and spatio-temporal cues ( C) are shown for the nearly non-spatial olfactory map ( A), the two-dimensional (2D) retino-tectal map ( B), and the unidimensional auditory map ( C). ( A) The olfactory map defines different olfactory receptor molecules in the dorsal and ventral zone of the olfactory epithelium. Receptor cells displaying distinct olfactory receptors ( A– D) project their axons to the dorsal and ventral domain of the olfactory bulb where they converge and initiate olfactory glomeruli formation. Note that olfactory fibers sort before they reach the olfactory bulb and that some ventral zone receptors are expressed in the dorsal zone but afferents sort to the ventral domain. Different opposing gradients of receptors facilitate further the sorting of olfactory afferents. Within this limited topology, the distribution of specific olfactory receptor–expressing receptor cells is fairly random. ( B) The retino-tectal system maps a 2D surface (the retina ganglion cells) onto another 2D surface (the midbrain roof or tectum opticum) via highly ordered optic nerve/tract fiber pathways. Within the midbrain, the presorted fibers are further guided by molecular gradients matching retinal gradients of ligand/receptor distributions. ( C) The auditory map is unidimensional, projecting a species-specific frequency range from the mammalian hearing organ, the organ of Corti via orderly distributed spiral ganglion neurons (SGNs), and their fibers in the auditory (cochlear) nerve onto the ventral cochlear nucleus complex. Both SGNs and cochlear nucleus neurons show a matching temporal progression of cell cycle exit followed by matching differentiation that could be assisted by spatio-temporal expression changes of receptors and ligands (shown here are the putative Wnt/Fzd combinations) that further support the fiber sorting. Note that this map projects a single frequency of an inner hair cell of the organ of Corti via a set of SGNs onto longitudinal columns of cochlear nucleus neurons in a cell-to-band projection and thus is not a point-to-point map as the olfactory and visual map. Moreover, afferents innervating multiple outer hair cells (OHCs) generate a band-to-band projection centrally. A, anterior; D, dorsal; L, lateral; M, medial; N, nasal; P, posterior; T, temporal; V, ventral. Modified after 12, 41, 53– 58.

