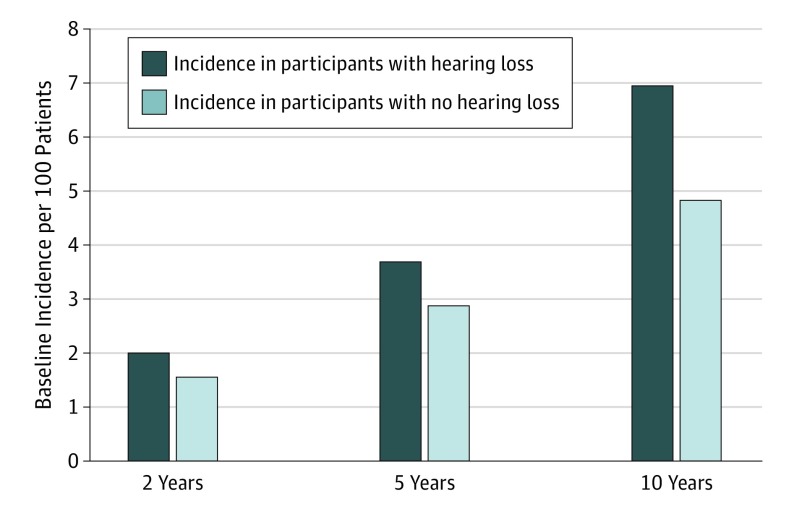
Figure 2. Unadjusted Difference in 30-Day Readmissions for Participants With Untreated Hearing Loss vs Participants With No Hearing Loss.
Bar graph represents the unadjusted difference in baseline incidence of 30-day readmissions in the 2- (risk difference [RD], 0.45; 95% CI, 0.31-0.58), 5- (RD, 0.82; 95% CI, 0.49-1.15), and 10- (RD, 0.45; 95% CI, 0.49-1.15) year cohorts with untreated and no hearing loss.

