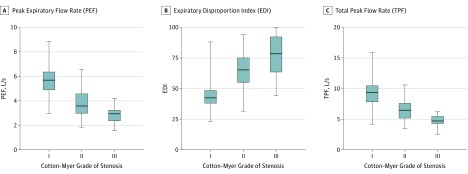
Figure 1. The PEF, EDI, and TPF Stratified by Grade of Subglottic Stenosis.
The horizontal lines within the boxes represent median values. Whiskers mark minimum and maximum values. Boxes define interquartile ranges. The EDI is the ratio of forced expiratory volume in 1 second (FEV1) measured in liters to PEF measured in liters per second multiplied by 100 (FEV1/PEF × 100).

