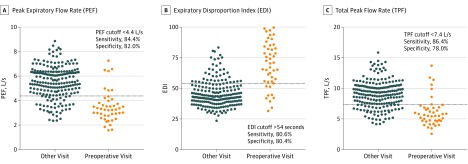
Figure 3. Comparison of PEF, EDI, and TPF Values Taken at Preoperative Visits Compared With All Other Visits.
Each dot represents a single a visit. The horizontal line represents the optimal cutoff value for differentiating between these 2 groups of data to predict receipt of surgical intervention. For PEF and TPF, a value below the line suggests future operative intervention. For EDI, a value above the line suggests future operative intervention.

