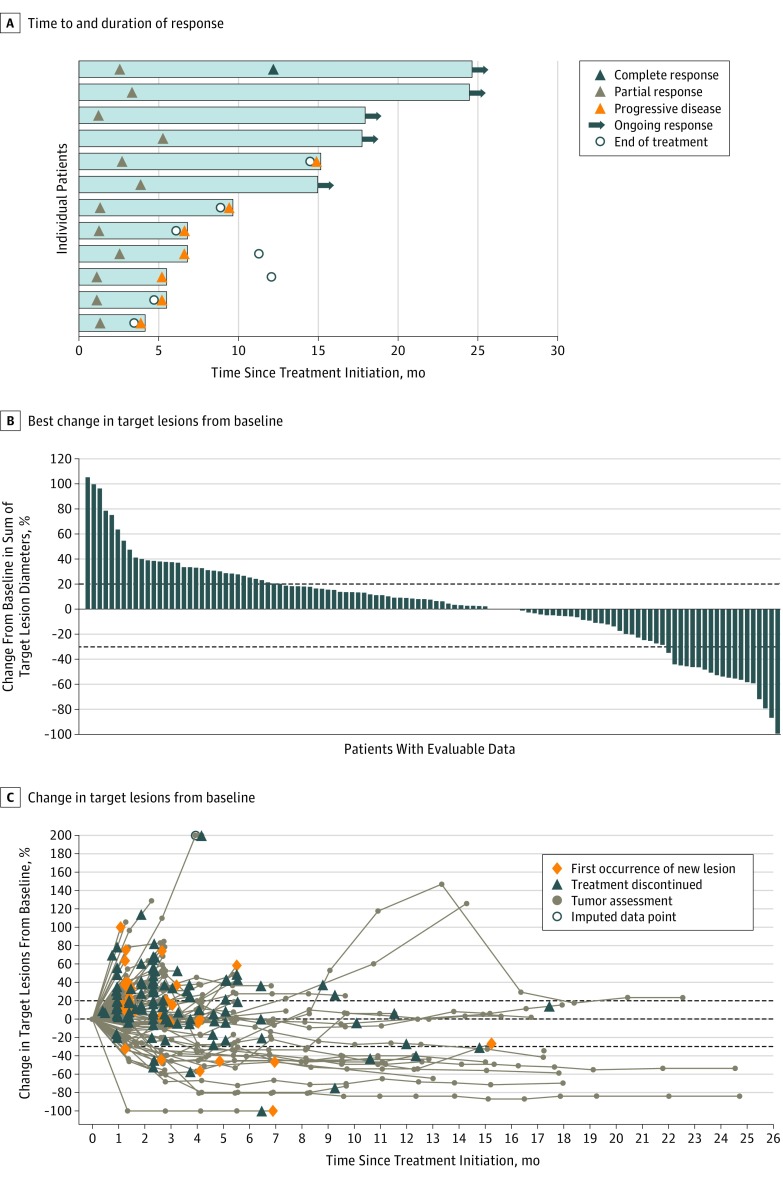
Figure 2. Antitumor Activity of Avelumab.
A, Time to and duration of response (n = 12). B, Best change in target lesions from baseline in patients with evaluable data (n = 114). Each bar represents a patient. Dotted lines indicate changes in target lesion size of −30% and +20%. C, Change in target lesions from baseline over time in patients with evaluable data (n = 114). Dotted lines indicate the changes in target lesion size of −30%, 0%, and +20%. Imputed data point is 205.0%.

