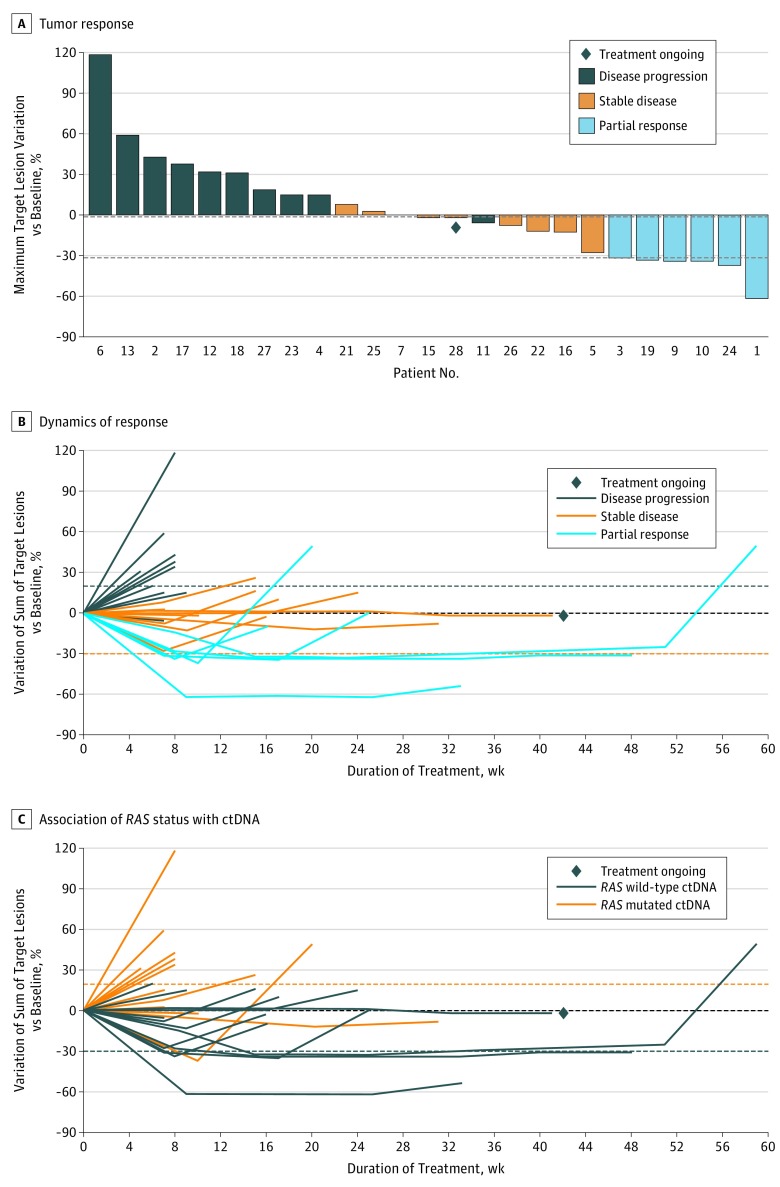
Figure 2. Radiographic Response.
A, Tumor response in 25 evaluable patients. The bars show the best percentage change in the target lesions from baseline. Three patients progressed before the first disease assessment. The dashed horizontal line at –30 indicates the threshold value to define partial response. B, Dynamics of response according to best response in 25 evaluable patients. The individual lines represent the percentage variation of the sum of target lesions at different time points. C, Association of RAS status with circulating tumor DNA (ctDNA) in 25 evaluable patients. The longitudinal assessment of the sum of target lesions is shown according to RAS mutational status of ctDNA at rechallenge baseline.

