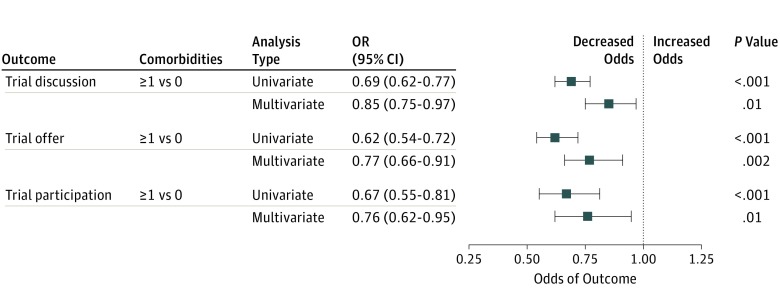
Figure 2. Forest Plot of Association Between Comorbidity Risk Score and Outcomes Using Common Comorbidity Variables.
Hypertension, prior cancer, and hearing loss occurred in at least 10% of patients and were independent predictors of each study outcome. In total, 2948 participants (53.6%) had 0 comorbidities, and 2551 (46.4%) had 1 or more comorbidities. For each analysis, the blue box represents the odds ratio and the horizontal line represents the 95% confidence interval (CI). Multivariate logistic regression analyses included covariate adjustment for demographic factors and income, and were stratified by cancer type. Results were similar if bypass surgery (frequency, 1.8%) was included (data not shown). OR indicates odds ratio.

