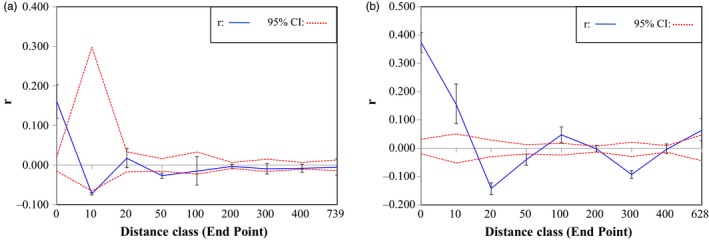
Figure 4.

Spatial autocorrelation analyses of Aphis craccivora genetic relatedness by geographical distance for locust‐group aphids, as assigned by STRUCTURE analysis. Error bars indicate r estimates from 999 bootstraps. Red dashed lines indicate ±95% confidence intervals. (a) Year 1 (2012) dataset, (b) Year 2 (2013) dataset
