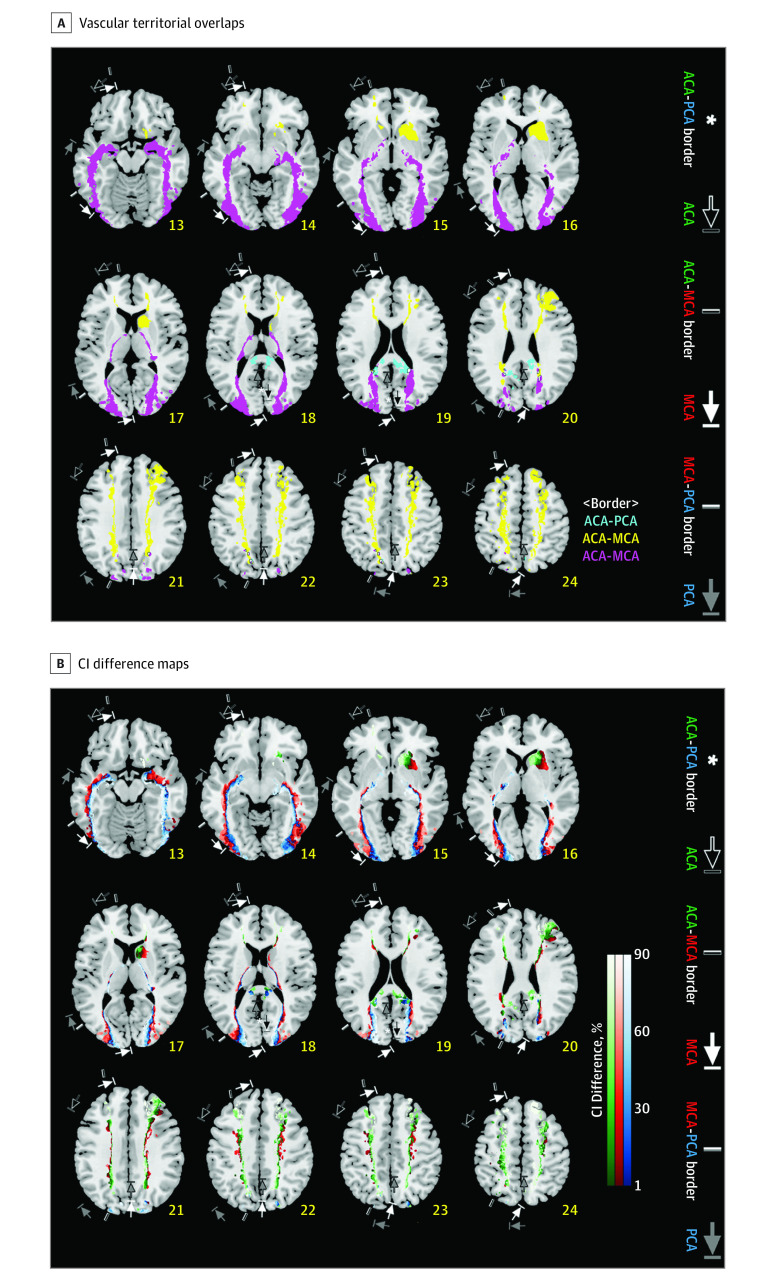
Figure 4. Interterritorial Border Zone Maps and Line Maps.
A, Vascular territorial overlaps are depicted, as derived from the infarct frequency maps in Figure 2A. Yellow, purple, and sky-blue areas, respectively, indicate the anterior cerebral artery (ACA)–middle cerebral artery (MCA), MCA–posterior cerebral artery (PCA), and ACA-PCA border zones. Each voxel in the border zones has infarct frequencies higher than 0 for at least 2 of ACA, MCA, and PCA infarction, with the frequency difference between the nonzero values being less than 10% (2.39%) of the highest lesion frequency (23.9%) among the values of all the supratentorial voxels in the 3 vascular groups. White areas that are outlined in black indicate the ACA-MCA-PCA border zone, representing the special case of triple territory overlap between all 3 vascular territories. B, Certainty Index (CI) Difference maps were generated, starting with the same data as in Figure 4A, by forcing a choice for each voxel to belong to only 1 parent vessel (the one with the highest CI), and color coding it appropriately: green (ACA), red (MCA), and blue (PCA). This reduces the border zones of Figure 4A to lines defined by color transitions between territories. Such lines are easier to describe and draw than zones of transition, but should be interpreted as representative of the wider transition zones, and not as a precise clinical entity. Please note that each interface between different color areas represents a border line. Annotations show territorial variabilities that are noted in the Tatu et al atlas.7 The right hemispheric brain mapping is depicted on the left side of the figure.

