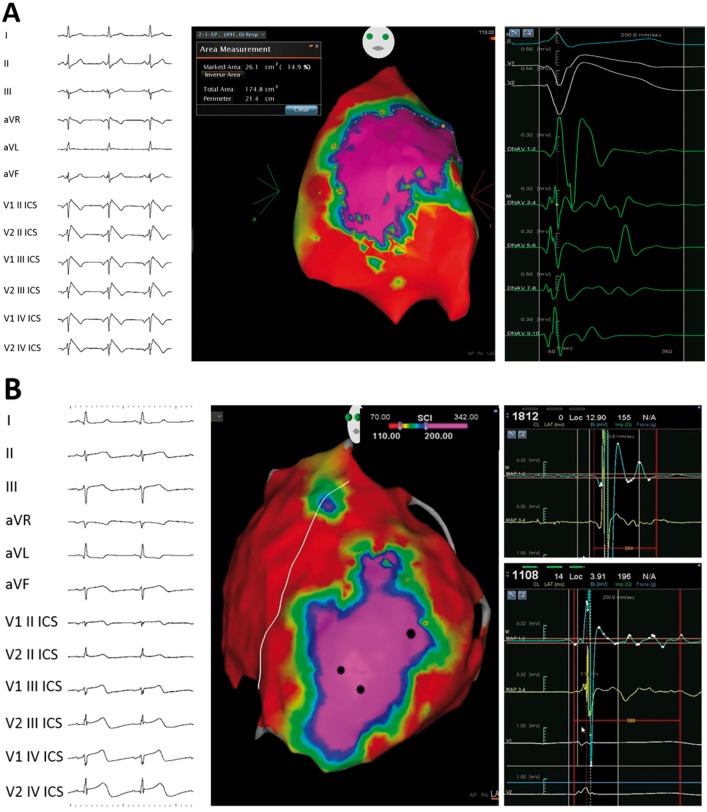
Figure 2.
Potential duration maps (PDMs). (A) Coved-type Br-ECG pattern (on the left), epicardial right ventricular PDM with an area exhibiting EGMs with duration >200 ms (purple, in central panel), and example of abnormal potentials found in the purple area (on the right) is shown. (B) ECG (on the left), left and right ventricular epicardial PDM (centre), and examples of abnormal EGMs (on the right) of a patient affected by left ventricular non-compaction is shown. Epicardial PDM shows an area exhibiting abnormal potentials with duration >200 ms (purple) in the epicardial apex of the left ventricle.

