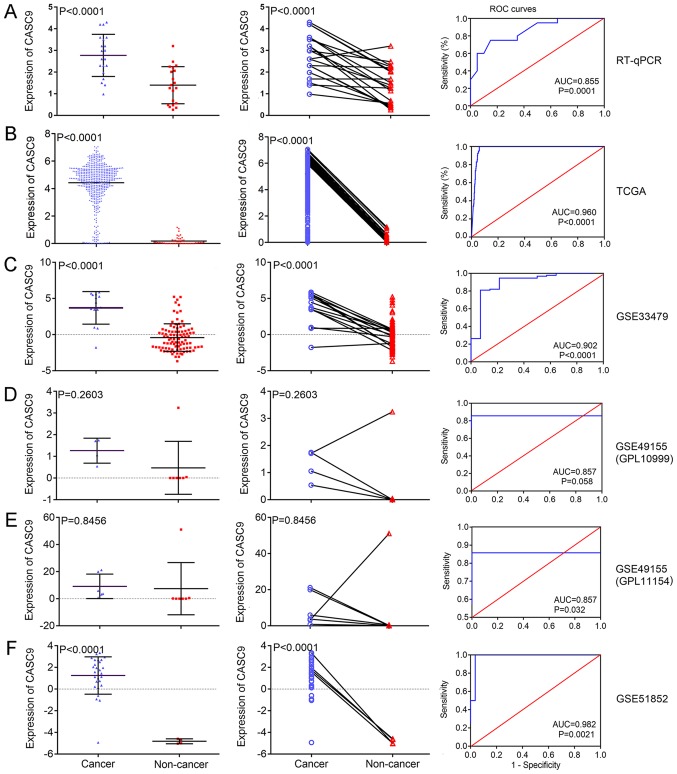
Figure 2.
CASC9 expression and its diagnostic ability in LUSC for all the investigated datasets. The scatter plots (left panels) and wiring diagrams (middle panels) present the differential expression levels of CASC9 in LUSC samples and non-cancer samples for (A) RT-qPCR, (B) TCGA and GEO microarray (C) GSE33479, (D) GSE49155 (GPL10999), (E) GSE49155 (GPL11154) and (F) GSE51852 data. The ROC curves (right panels) demonstrate the capacity of CASC9 to identify LUSC from normal samples. CASC9, cancer susceptibility candidate 9; LUSC, lung squamous cell carcinoma; RT-qPCR, reverse transcription-quantitative polymerase chain reaction; TCGA, The Cancer Genome Atlas; GEO, Gene Expression Omnibus; ROC, receiver operating characteristic; AUC, area under the curve.

