Fig. 3.
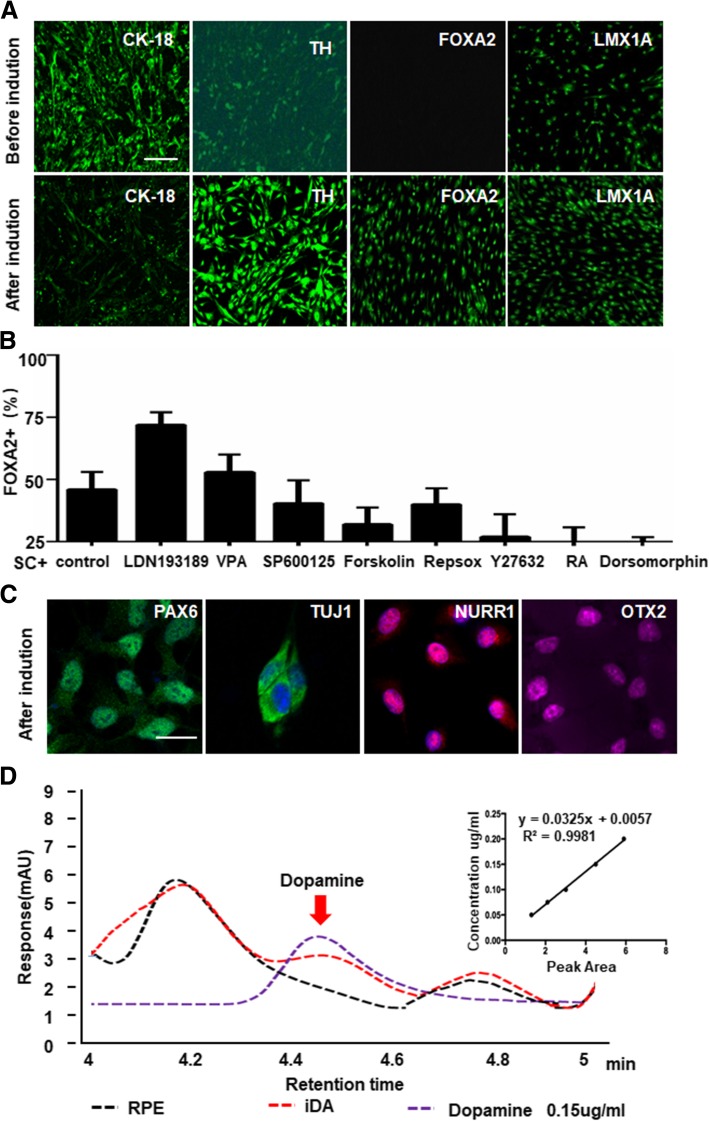
Chemically induced reprogramming of RPE cells into dopamine-producing cells. a Immunofluorescent staining of RPE cells before or 4 days after induction for CK-18, TH, FOXA2, and LMX1A, (scale bar: 100 μm). b Percentage of FOXA2+ cells in chemical induction systems with different small molecules. Com SC, combination of SB431542 and CHIR99021 was used as control. (Statistical analysis from Fig. S2A). Dates are expressed as mean + SD. c Chemically induced RPE cells expressed neuronal markers, including PAX6, NURR1, TUJ1, and OTX2 (scale bar: 20 μm). d Determination of dopamine by high-performance liquid chromatography (HPLC; red, the supernatant from cultured RPE cells after chemical induction; purple, 0.15 μg/ml dopamine standards; black, supernatant from cultured RPE cells before induction). Linear calibration curve of dopamine concentrations. The curve was plotted by integrated peak area ratio versus dopamine

