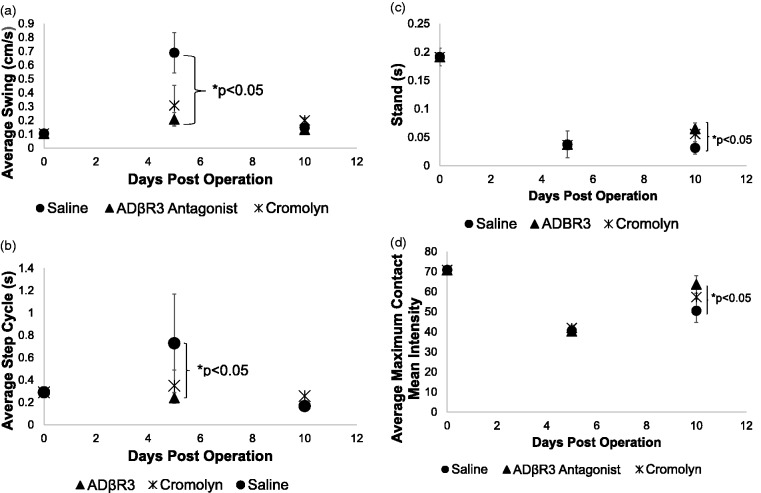
Figure 4.
Quantification of (a) limb swing, (b) step cycle, (c) stand, and (d) maximum contact/maximum intensity of the left hind limb. Mice were initially run on the catwalk system, and values were recorded. These pre-operative values are shown on the graph as day 0. Mice then underwent surgery where chromic gut sutures were loosely ligated around the left limb sciatic nerve to induce neuroma. The mice were rerun on the catwalk system 5 and 10 days post-surgery. Values for the left hind limb possessing the neuroma were used for analysis. Symbols depict the mean for each group. Error bars depict the standard error of the mean, and statistical significance was calculated between groups using a one way analysis of variance with a Tukey correction. (a and b) Statistical significance is shown between the L-748,337 and saline groups on day 5 (bracket) or (c and d) day 10 (bracket). The graph does not show (a) the comparison of pre-operative and day 10 values resulted in saline and cromolyn-treated groups being highly statistically significant (p < 0.001) and L-748,337-treated group being statistically different (p < 0.05) for limb swing. (b) Comparisons between pre-operative and day 10 values for step cycle showed a significant difference only in the saline and cromolyn-treated groups (p < 0.001). The ADRβ3 antagonist group was not statistically different from the pre-operative values. (c and d) Comparison between the pre-operative and day 10 values per group were significantly different (p < 0.001). ADRβ3: beta-3 adrenergic receptor.

