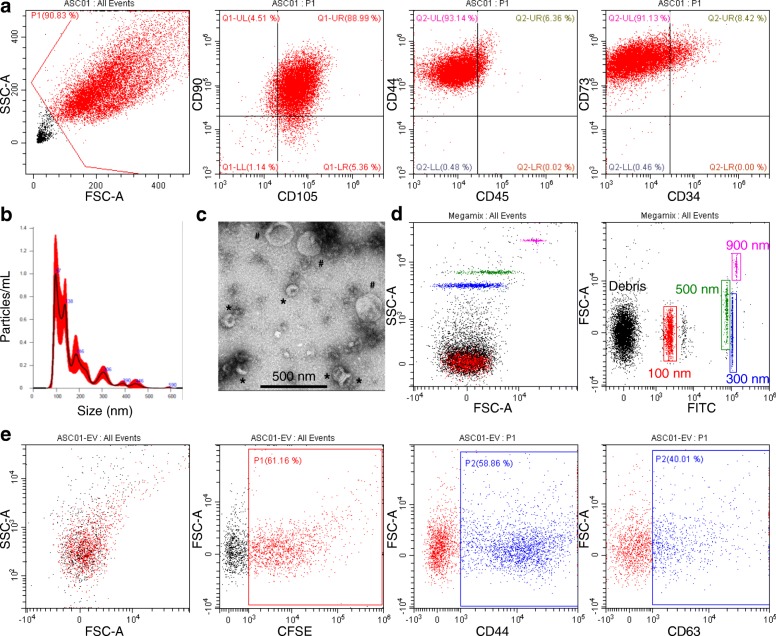
Fig. 1.
Characterization of ASCs and ASC-EVs. a Representative dot plots of MSC (CD44-73-90-105) and hemato-endothelial (CD34-45) markers in ASCs. One representative cell isolate is shown. b NTA analysis of representative cell culture supernatant showing the presence of particles in the range between 50 and 500 nm. c Electron micrographs of ASC-derived small size (asterisk: possible exosomes) and large size (number sign: microvesicles) vesicles. d Setting up the EV-dedicated flow cytometer. The resolution of the reference bead mix indicates the flow cytometer performance in light scattering at default settings. Left cytogram shows side scatter (SSC) versus forward scatter (FSC). Right cytogram depicts FSC versus 535/35 (green fluorescence triggering) channel. Four fluorescent populations (100, 300, 500, and 900 nm) were resolved from the instrument noise. e CFSE-labeled ASC-EVs stained with stem cell (CD44) and EV (CD63) markers. ASC-EVs were first gated in the FITC channel (CFSE positive)

