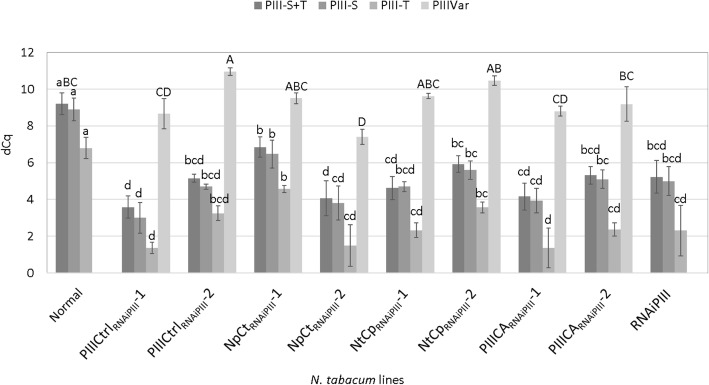
Fig. 3.
Accumulation of PELPIII -S, −T and variant transcripts in normal, complementation and RNAiPIII lines. The dCq is a log2 scale, calculated from two technical replicates and three biological replicates and actin was used as the reference gene. The fold change was calculated by dividing the mRNA levels being compared after converting from log2 to linear values. The error bars are standard deviations. Letters represent Tukey’s HSD mean separation at α = 0.05 among each PELPIII type (S, T, S + T and variant PELPIII) evaluated. Capital letters compares PELPIII-S + T mRNA accumulation in normal plants to PELPIII variant mRNA accumulation in other lines. Lower case letters compare S + T, S and T PELPIII mRNA accumulation among all N. tabacum lines. Normal: non-transgenic N. tabacum with wildtype levels of PELPIII (S and T); Complementation lines: PIIICtrlRNAiPIII independent transformant lines 1 and 2 with the PIIICtrl and RNAiPIII transgenes; NpCtRNAiPIII independent transformant lines 1 and 2 has the NpCt (PELPIII NTD and TTS CTD) and RNAiPIII transgenes; NtCpRNAiPIII independent transformant lines 1 and 2 has the NtCp (TTS NTD and PELPIII CTD) and RNAiPIII transgenes; PIIICARNAiPIII independent transformant lines 1 and 2 has the PIIICA (cysteine to alanine mutation in PELPIII NTD) and RNAiPIII transgenes; RNAiPIII has the RNAiPIII transgene (reduced PELPIII-S and T) that was crossed with variant PELPIII transgenic lines to produce the complementation lines. PIIIVar is the mRNA accumulation from the control or complementation gene constructs

