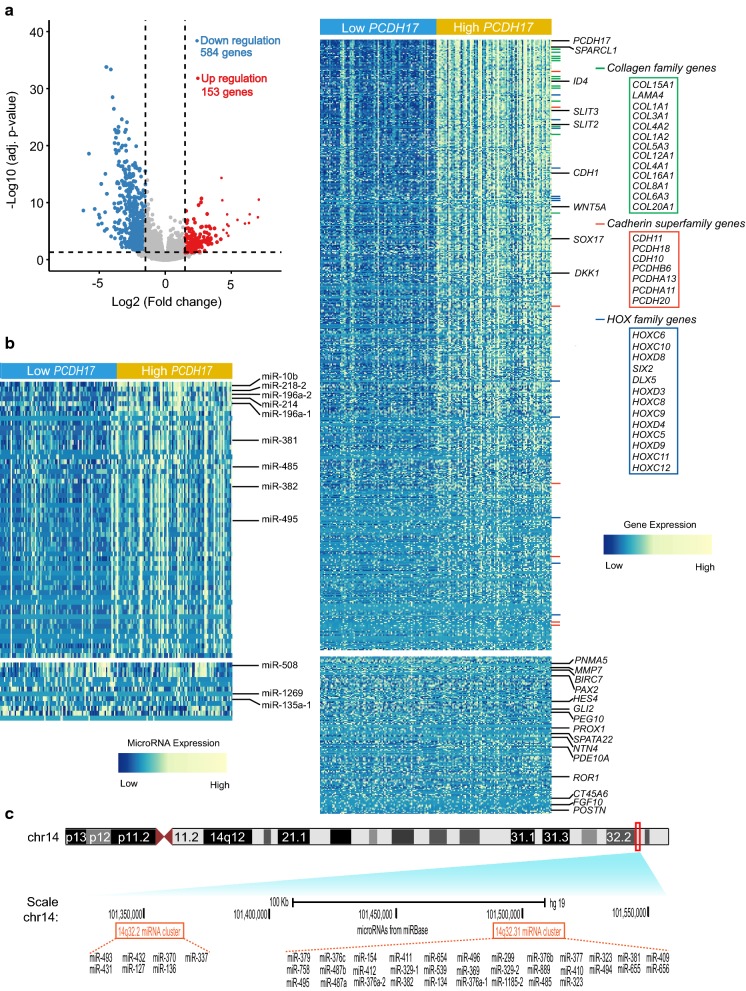
Fig. 8.
Gene/microRNA signatures associated with PCDH17 expression. a Left: volcano plot showing gene expression differences between patients with low and high PCDH17 expression. Significantly down-regulated genes (blue points) and up-regulated genes (red points) in patients with low PCDH17 expression are indicated. Right: heatmap showing the gene expression signature associated with PCDH17 expression (FDR < 0.05, |log2 FC| > 1.5). Up-regulated and down-regulated genes mentioned in the text are labeled on the rows or in the boxes. b Heatmap showing the microRNA expression signature associated with PCDH17 expression (FDR < 0.05, |log2 FC| > 1.5). Up-regulated and down-regulated microRNAs mentioned in the text are indicated. c UCSC browser screenshot of the microRNAs located on the 14q32 region. Top shows schematic representation of chromosome 14, with the 14q32 locus indicated as a red rectangle. Bottom shows the relative positions of the 39 microRNAs that are positively associated with PCDH17 expression (left, the 14q32.2 microRNA cluster; right, the 14q32.31 microRNA cluster)

