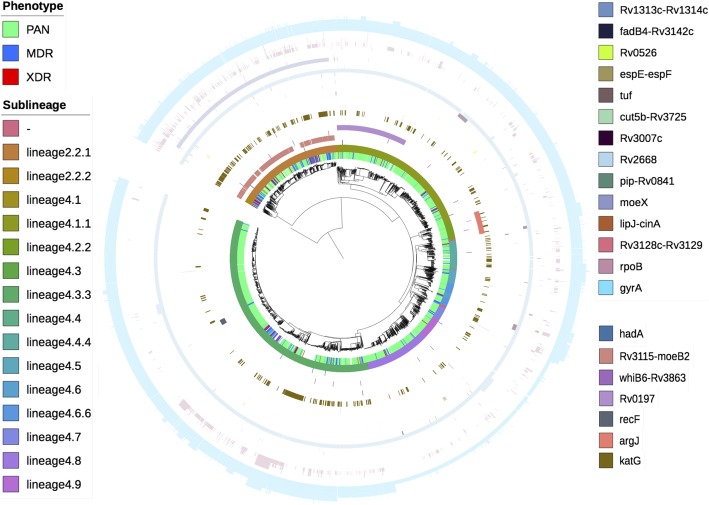
Fig. 1.
Phylogenetic tree of all samples: coloured by phenotype, sublineage and genotype for novel variants alongside katG, rpoB and gyrA. From inner to outer, each track is coloured by; drug-resistance phenotype, sublineage, variant genotype for; hadA (732110), Rv3115-moeB2 (3482717), whiB6-Rv3863 (4338594), Rv0197 (232574), recF (4047), argJ (1867614), katG (2155168); locus genotype for; Rv1313c-Rv1314c, fadB4-Rv3142c, Rv0526, espE-espF, tuf, cut5b-Rv3725, Rv3007c, Rv2668, pip-Rv0841, moeX, lipJ-cinA, Rv3128c-Rv3129, rpoB, gyrA. Variant genotype is coloured in samples where a non-reference variant is present with respect to H37rv reference and variant position is given in brackets. Locus genotype is coloured in samples with one or more non-synonymous or intergenic variants at each locus with respect to H37rv reference, relative height of the bar reflects number of variants at each loci

