Fig. 1.

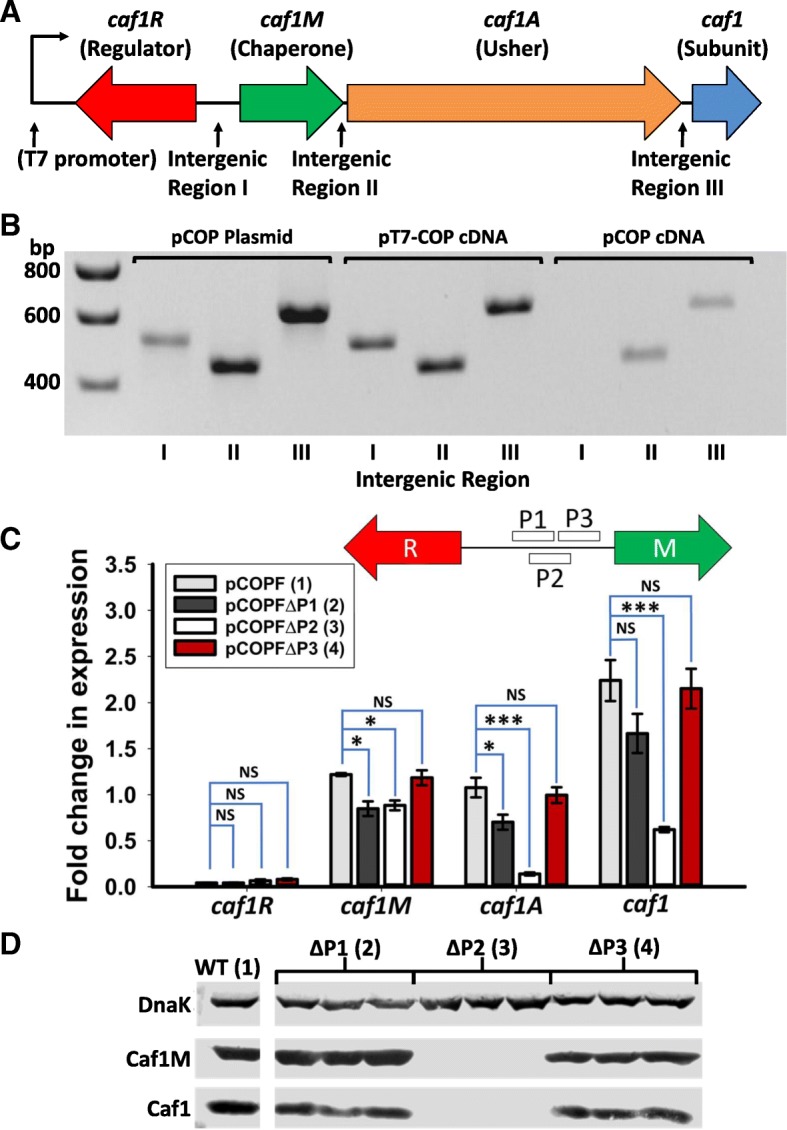
Determination of caf1 transcript size and promoter site. a Organisation of the caf1 operon. The position of the T7 promoter, found in the artificial pT7-COP plasmid is highlighted. b Agarose gel showing the PCR amplification products corresponding to the three intergenic regions of the caf1 operon generated from either the pCOP plasmid, or cDNA made using mRNA from cultures of E. coli transformed with pT7-COP or pCOP plasmids and grown at 35 °C for 16 h. Both plasmids contain the caf1 operon as shown in (a). c Transcript levels of the caf1 operon genes as determined by RT-PCR, from cultures grown for 16 h of E. coli transformed with either pCOPF (full caf1 operon, Caf1R,M and A have FLAG tags), or pCOPF with the proposed promoter regions P1,2 or 3 deleted. Three cultures of each condition were grown, with RT-PCR reactions run in duplicate for each culture. Bar heights correspond to mean fold-change in expression relative to β-lactamase. Error bars represent standard error of the mean (S.E.M) from three biological replicates. Asterisks represent significant differences between groups (* - P < 0.05, ** - P < 0.01, *** - P < 0.001, NS – not significant, determined by ANOVA with Holm- Šidák post-hoc test). A diagram detailing the positions of the P1, 2 and 3 regions is shown in the top right of the graph. d Western blot of the above cultures showing the levels of Caf1M and Caf1 (detected by anti-FLAG tag and anti-Caf1 antibodies respectively), and using DnaK (detected by an anti-DnaK antibody) as a loading control
