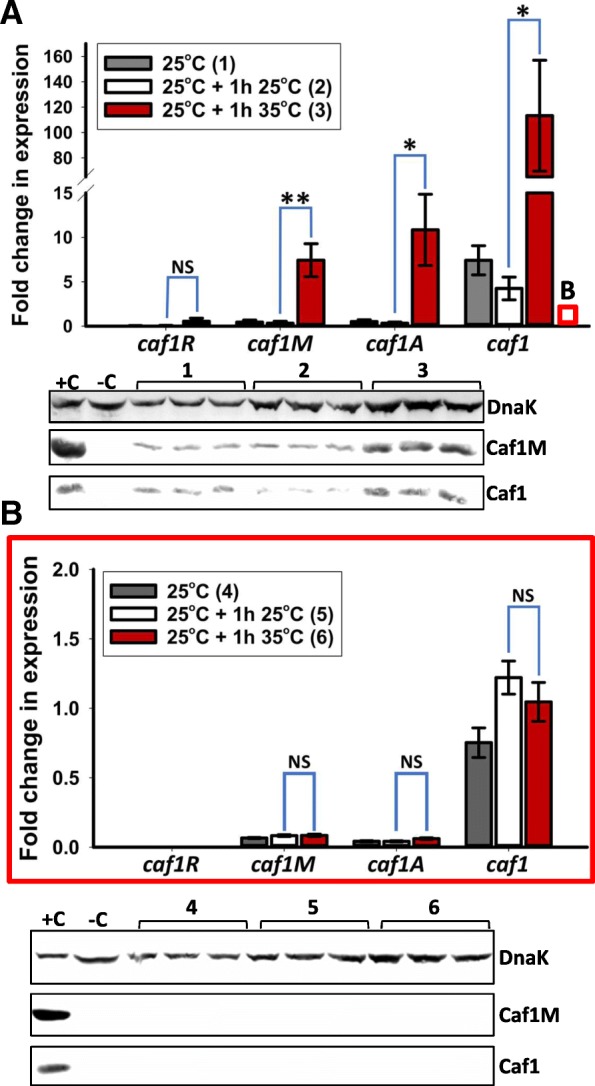
Fig. 3.

caf1 operon gene expression is temperature and Caf1R dependent. Transcript levels, determined by RT-PCR, of each caf1 gene are shown for cultures of E. coli transformed with pCOPF (full caf1 operon, (a)) and pCOPFΔR (caf1 operon, Caf1R deleted, (b)), grown at 25 °C overnight (~ 16 h), then either 25 °C or 35 °C for 1 further hour. The red box in a shows the approximate scale of the Y-axis in b. Three cultures of each condition were grown, with RT-PCR reactions run in duplicate for each culture. Bar heights correspond to mean fold-change in expression relative to β-lactamase. Error bars represent standard error of the mean (S.E.M) from three biological replicates. Asterisks represent significant differences between groups (* - P < 0.05, ** - P < 0.01, *** - P < 0.001, NS – not significant, determined by ANOVA with Holm- Šidák post-hoc test). Western blots showing the levels of Caf1M and Caf1 (detected by anti-FLAG tag and anti-Caf1 antibodies respectively) in the cell pellets of the expression cultures are displayed underneath each graph, using DnaK probed with an anti-DnaK antibody as a loading control. +C and –C represent the pellets of BL21(DE3) cells transformed with pCOPF and untransformed respectively, and grown for 16 h at 35 °C
