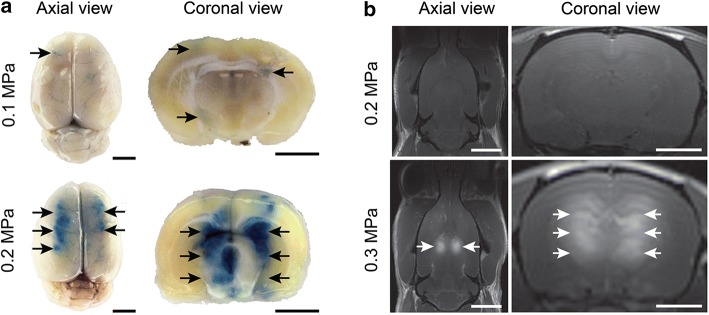
Fig. 8.
Representative brain images of animals treated for BBB opening. a The group of smaller animals treated at 0.1 MPa (top) and 0.2 MPa (bottom) followed by the systemic administration of EBD. Arrows indicate the locations of EBD (blue) signal in whole brains and brain sections. b The group of larger animals treated at 0.2 MPa (top) and 0.3 MPa (bottom) followed by systemic administration of gadolinium contrast. Arrows indicate the locations of contrast (hyperintense signal) in T1w MR coronal and axial images. Scale bars in the axial (left) and coronal (right) images correspond to 5 mm and 2.5 mm, respectively

