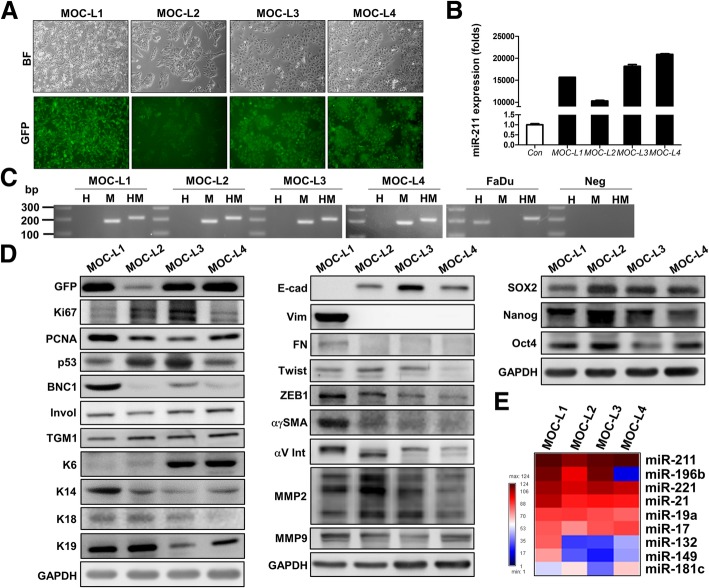
Fig. 1.
Establishing the cell lines and their characterization. a Cell morphology and fluorescence image of MOC-L1 to MOC-L4. × 100. Upper, bright field inverted microscopy; Lower, fluorescence microscopy. b Quantitative PCR analysis. This shows the high level of miR-211 expression in these four cell lines. c Typing of the cell origins by PCR analysis. H, human; M, mouse; HM, both human and mouse. The results show that these cell lines originated from mouse. Neg, negative control. The other lanes in gels are molecular weight markers. d Western blot analysis of gene expression across the various cell lines. Left, proliferation and differentiation genes; Middle, EMT markers; right, stemness markers. e The expression profile algorithm of the selected miRNAs in MOC cell lines relative to the SAS cell line. The miRNAs analyzed are shown in Additional file 1: Figure S1a

