Fig. 2.
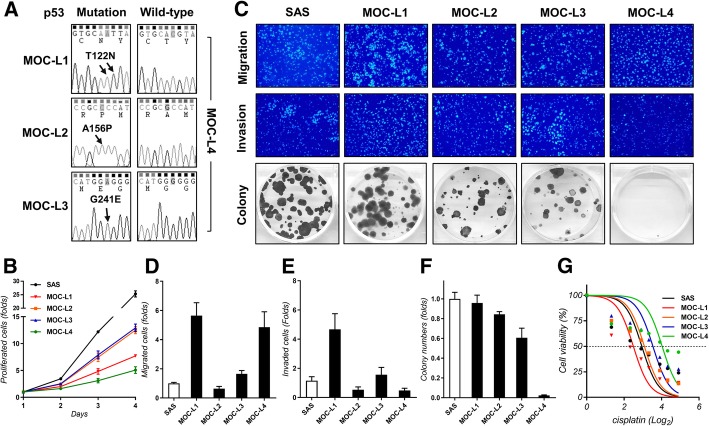
Analysis of p53 mutation and phenotype. a p53 sequencing. It reveals the presence of p53 missense mutations in the genomic DNA of MOC-L1, MOC-L2, and MOC-L3. The right panels show the sequencing of the MOC-L4 cell line demonstrating the absence of a p53 mutation. Arrows indicate the mutated nucleotides in the other cell lines. b Proliferation assay. c Representative results showing the migration (Upper, × 100), invasion (Middle, × 100) and colony formation assays (Lower). d-f Quantification of migration, invasion and colony formation capability relative to the SAS cell line. g Dose-response curve of the cell lines following 0, 2.5, 5, 7.5, 10, 15, 20, and 30 μM CDDP treatment for 24 h

