Fig. 4.
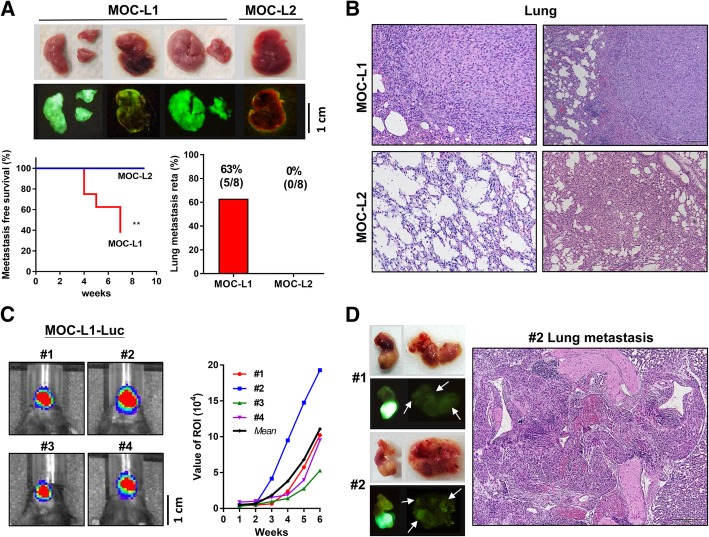
High metastasis rate of the MOC-L1 cell line. a Tail vein injection of MOC-L1 and MOC-L2 cells into C57BL/6 mice. The survival status over 7 weeks (for MOC-L1) and 9 weeks (for MOC-L2) and an examination of the resected lungs. Upper, representative gross pictures. Middle, fluorescence images of the lungs. Note the intense and diffuse fluorescence in the lungs of the mice that have received a MOC-L1 cell injection, but the absence of these findings in the mice who have received the injection of MOC-L2 cells. Lower Left, mice who received the MOC-L1 injection exhibit a significantly worse metastatic-free survival. **, p < 0.01 b Representative tissue sections of the lungs. Metastatic lesions are evident in the lungs of mice that had received an injection of MOC-L1 cells. The sections of lungs received the injection of MOC-L2 cells show normal structure or chronic inflammatory states. X100. The quantitation of lung metastasis is depicted in the Lower Right panel in a. Only mice that have received the MOC-L1 injection show lung metastasis. c Orthotopic xenotransplantation of MOC-L1-Luc cells into four C57BL/6 mouse hosts (#1 - #4). Left, Detection of luciferase activity at week 6. Right, the real-time luciferase measurements that illustrate the growth potential of the MOC-L1-Luc cell subclone in their hosts. The tumor in mouse #2 exhibits the most conspicuous growth. d Detection of green fluorescence. Left, representative harvested tongue and neck tissue samples. Upper, gross images; Lower, fluorescence images. Note the faint fluorescent spots indicated by arrows in the neck tissues. Right, a representative histopathological section of lung. X200. This reveals the metastasis of cells to the hilar region of the lung and adjacent tissues

