Fig. 5.
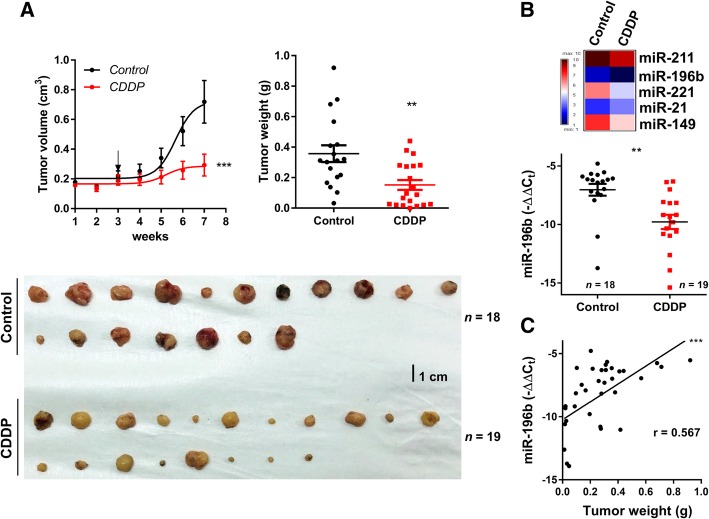
CDDP treatment abrogates the growth of MOC-L1 xenografts. a Left, growth curve of subcutaneous MOC-L1 xenografts in C57BL/6 mice over seven weeks. Arrow, start point for intraperitoneally CDDP or normal saline injection. Lower, the resected tumors are harvested at endpoint. Right, quantification of tumor weight. CDDP treatment significantly decreases the weight of the MOC-L1 xenografts. b Upper, miRNA expression profile of the control tumors and the CDDP treated tumors. Lower, miR-196b expression. The results show a decrease in miR-196b expression in the CDDP treated tumors relative to the control tumors. c Correlation analysis. This reveals a correlation between miR-196b expression and the weight of the xenografts. **, p < 0.01; ***, p < 0.001

