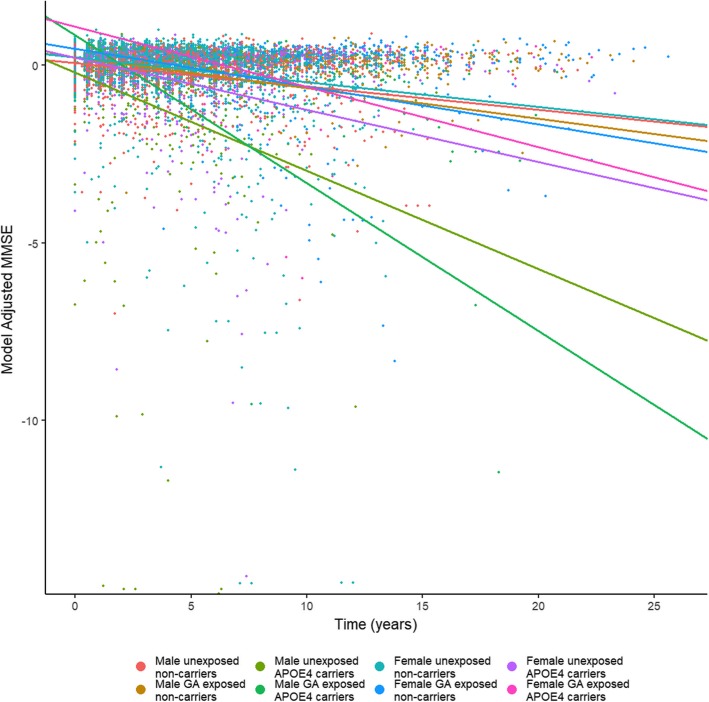
Fig. 1.
Rate of change in MMSE score. Rate of change scatterplot and group trajectories in model-adjusted MMSE score over the study period for each of the eight sex/genotype/surgical exposure groups. Time “0” corresponds to study enrollment. Each point represents an individual visit. MMSE Mini-Mental State Examination

