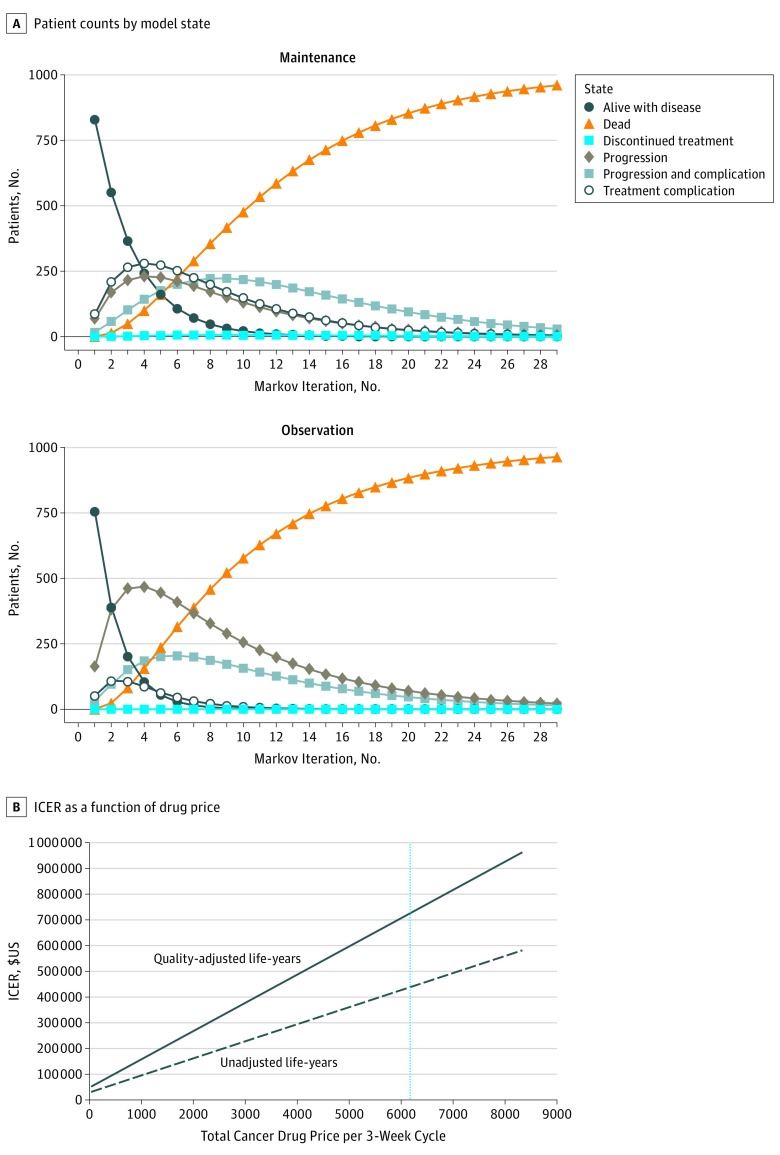
Figure 1. Patient Counts and Incremental Cost-effectiveness Ratios (ICERs).
A, The model begins with 1000 patients in the alive-with-disease state. Their progression through the other model states by model iteration is indicated for the maintenance and observation treatment groups. The CAIRO3 randomized clinical trial4 reported times to first progression event of 8.5 and 4.1 months in the maintenance and observation groups, respectively, which correspond to 4.11 and 1.98 Markov iterations, while overall survival times of 21.6 and 18.1 months correspond to 10.44 and 8.74 iterations. B, ICERs per quality-adjusted life-year (solid line) and per unadjusted life-year (dashed line) are shown. The vertical line indicates the current price ($6173) paid by Medicare. For a willingness to pay of $200 000 per unadjusted life-year, the corresponding total drug cost would be approximately $2500 per 3-week cycle.

