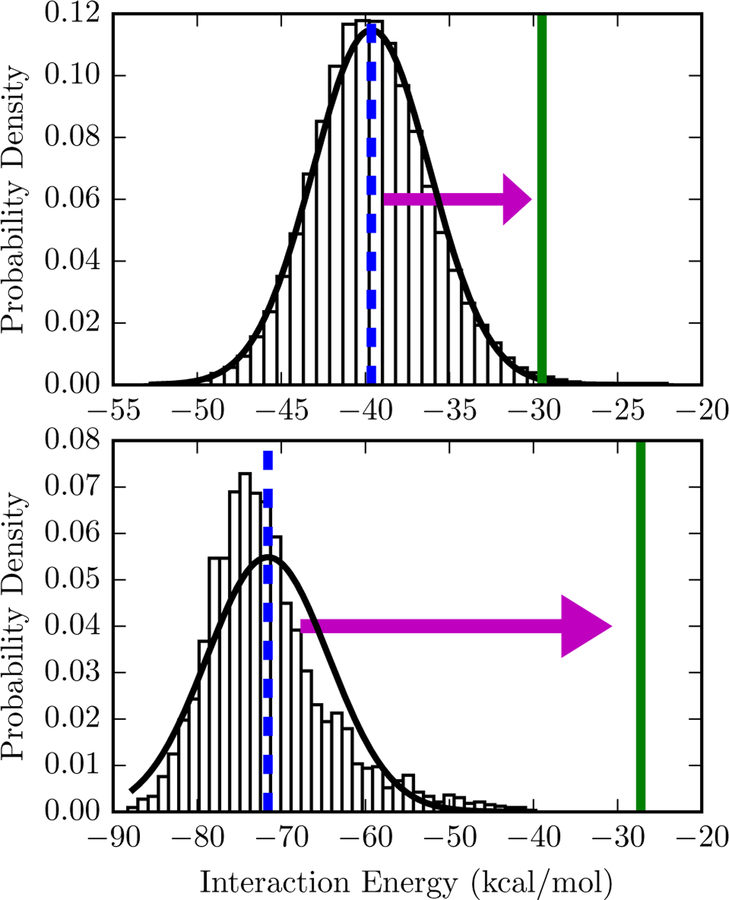
Figure 2: Comparison of free energy estimates for two interaction energy distributions.
The bars are a normalized histogram of interaction energies observed in a simulation of the protein-ligand complex starting from 3mxf (top) or 4ogj (bottom) in the PDB. Top: The mean interaction energy, −39.6 kcal/mol and is shown with a dashed blue vertical line. Since the standard deviation of the interaction energy is 3.5 kcal/mol, the second-order truncation of the cumulant expansion is −29.5 kcal/mol, shown with a solid green line. A Gaussian distribution based on the sample mean and standard deviation is shown as a solid black line. Bottom: The same lines and symbols are used for 4ogj. The mean interaction and standard deviation of the interaction energy is −71.59 and 7.3 kcal/mol, respectively. The second-order truncation of the cumulant expansion is −27.25 kcal/mol. Comparable figures for all systems are available in Figure S2 of the Supporting Information.

