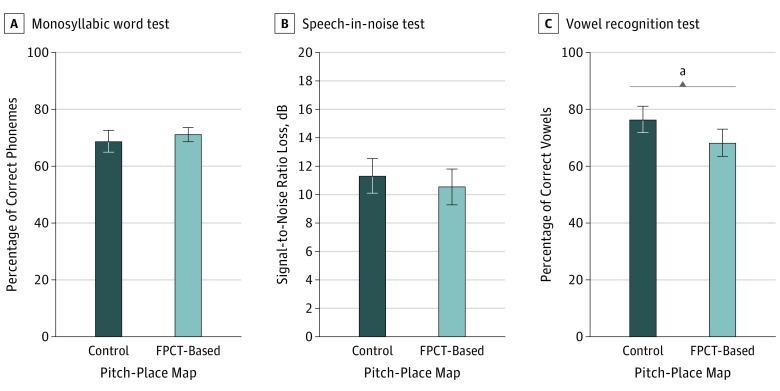
Figure 3. Speech Perception Performances While Using the Modified Clinical Map vs the Image-Based Experimental Map.
There was no significant difference between the consonant-nucleus-consonant test (150 phonemes per list) (A) and Bamford-Kowal-Bench Speech-in-Noise test (B) (−1.0% correct phonemes; 95% CI, −2.5% to 6.0%). On average, cochlear implant users did better on the Iowa vowel recognition test (80 trials) (C) when using their modified clinical maps compared with their image-based experimental maps (12% increase in correct vowel recognition; 95% CI, 1%-17%). FPCT indicates flat-panel computed tomography. Error bars indicate 95% CIs.
aStatistical significance with P < .05.

