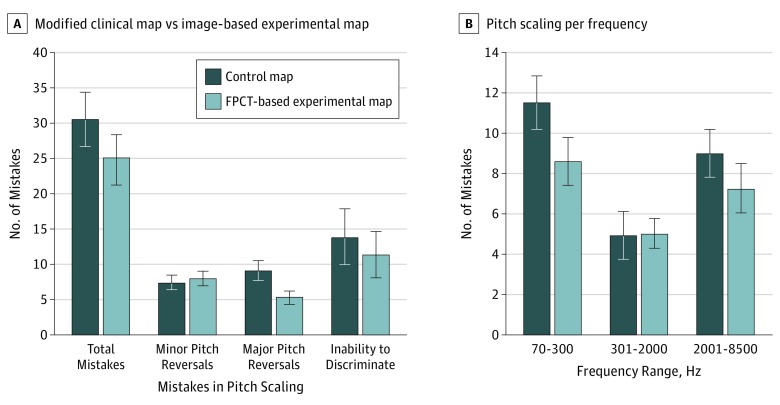
Figure 4. Mean Performance Data for the Pitch-Scaling Task Using the Modified Clinical Map vs the Image-Based Experimental Map.
A, Number of mistakes in the pitch-scaling task using the modified clinical map vs the image-based experimental map. The left column compares the total number of mistakes made during the pitch-scaling task between the control and experimental groups. These mistakes were broken down into subcategories: minor pitch reversals, major pitch reversals, and inability to discriminate between 2 pitches. There was a significant median difference of 4 more correct answers (95% CI, 0-8) in the pitch-scaling task with the experimental map compared with the control map. A Wilcoxon signed rank test determined that there was a significant increase in the number of major pitch reversals made with use of the control map compared with the experimental map (difference of 4 in number of mistakes; 95% CI, 0.5-7 mistakes). B, The association between the pitch-place map and frequency range and the number of pitch-scaling mistakes. Low-frequency range was defined as 70 to 300 Hz; midfrequency range, 301 to 2000 Hz; and high-frequency range, 2001 to 8500 Hz. A significant difference was noted in the total number of low-frequency (mean [SD] 5.100 [1.046]; 95% CI, 2.258-7.942) and high-frequency (mean [SD] 3.167 [0.804]; 95% CI, 0.981-5.352) range mistakes made in the pitch-scaling task between the control and the experimental maps. Error bars indicate 95% CIs. FPCT indicates flat-panel computed tomography.

