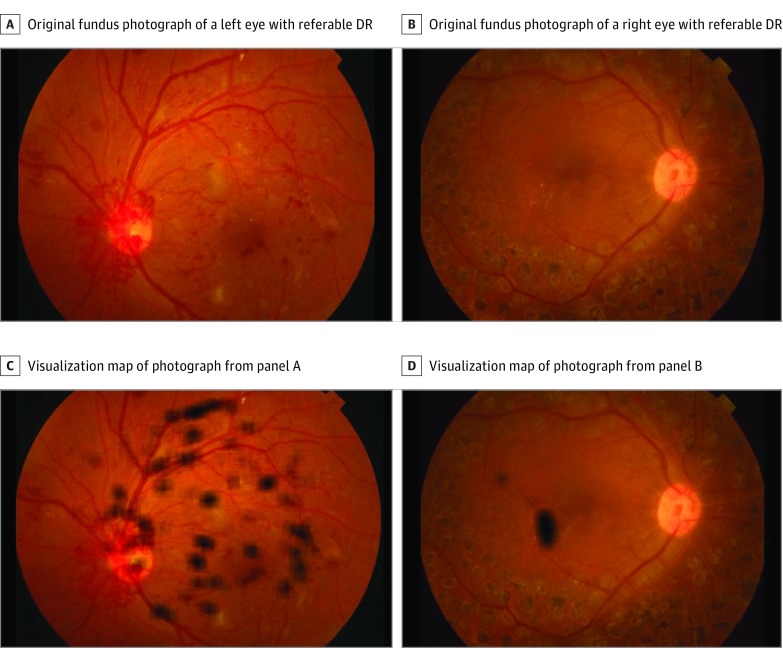
Figure 2. Examples of Visualization Maps of True-Positive Cases of Diabetic Retinopathy (DR).
A and B, Original color fundus photographs without heat maps. C, Heat map of image from panel A predominantly visualizing retinal vascular changes in the superior arcade and neovascularization at the optic nerve head. D, Heat map of image from panel B predominantly visualizing exudates close to the macula.

