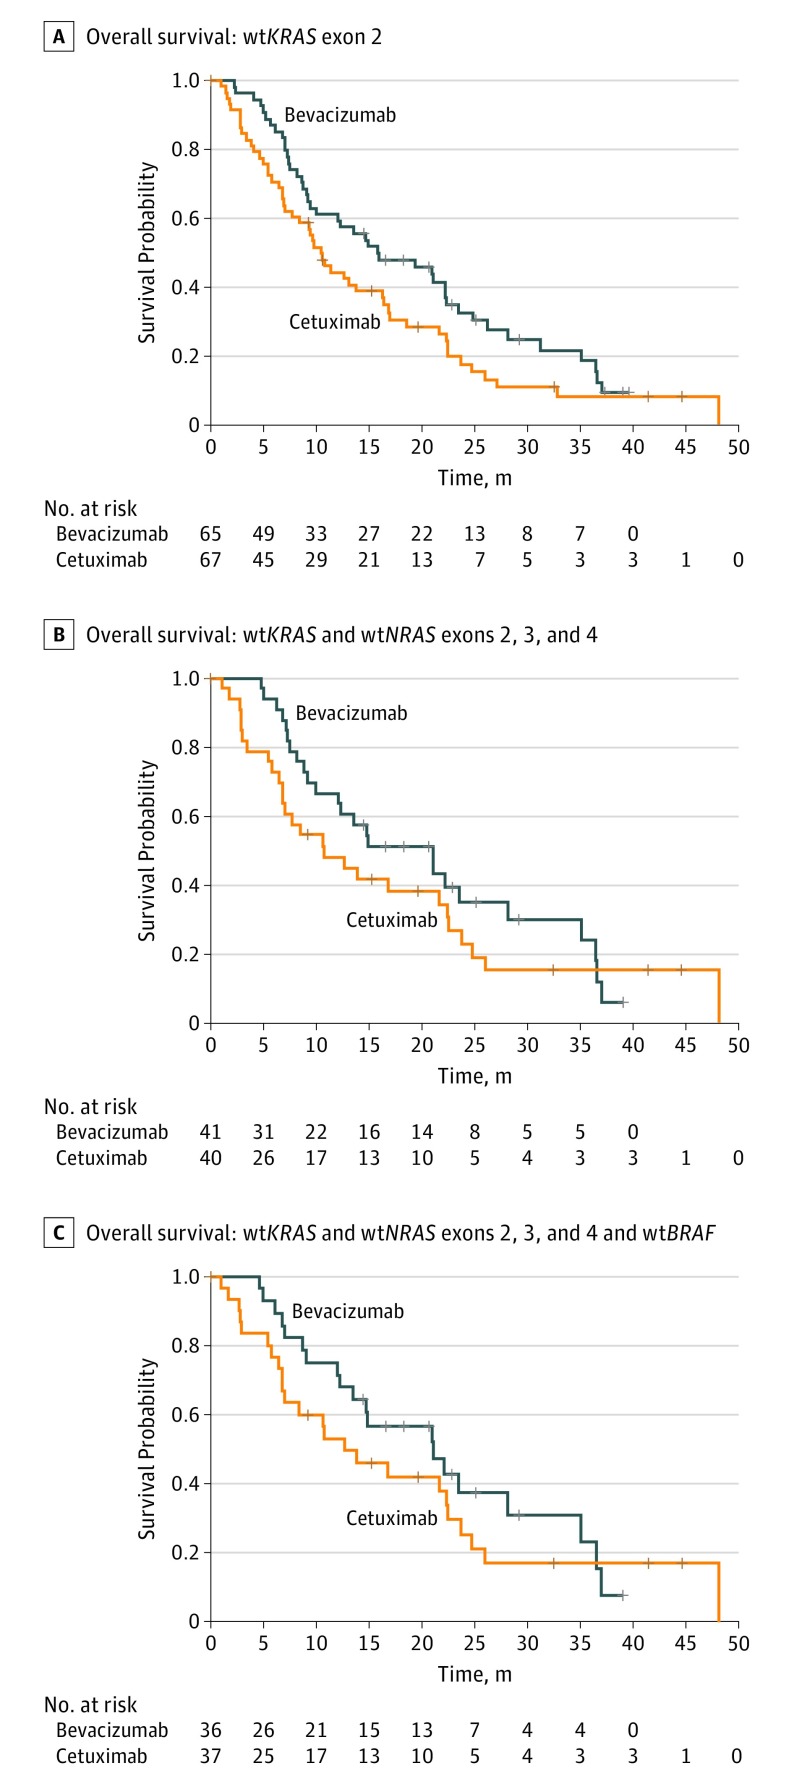
Figure 3. Kaplan-Meier Estimates of Overall Survival.
A, Overall survival among patients with wild-type (wt) KRAS exon 2 (log-rank P = .07). B, Overall survival among patients with wtKRAS and wtNRAS exons 2, 3, and 4 (log-rank P = .32). C, Overall survival among patients with wtKRAS and wtNRAS exons 2, 3, and 4 and wtBRAF (log-rank P = .37). Plus signs indicate censored patients.

